1 Introduction
Rock slope instability is a commonly encountered geological hazard that requires effective measures to predict and prevent landslides. Currently, three main methods are used to analyze the stability of rock slopes: the limit equilibrium method (LEM) [1, 2], the limit analysis method (LAM) [3, 4], and the numerical simulation method (NSM) [5]. The NSM involves using numerical software to assess slope stability by resolving the stress field and displacement distribution of the slope [6]. Researchers have integrated the NSM with statistical theory to enhance the reliability and precision of stability analysis outcomes [7]. However, the NSMs typically involve model simplification and manually setting relevant model parameters, which presents challenges in the experience of engineers. The LAM utilizes the principles of plastic mechanics to determine the upper and lower limits of the slope stability by constructing kinematic and static permissive fields, respectively. In practical engineering applications, the lower limit solution obtained from LAM is considered more conservative and safer than the upper limit solution. Nevertheless, the construction of the static field in the LAM presents challenges, and obtaining an exact solution adds complexity, thus limiting its practical application in engineering. The LEM relies on simple limit equilibrium (LE) theory and can provide a unique and deterministic result for slope stability analysis by considering the equilibrium conditions of the sliding body [8]. This method offers reliable calculations and has been widely implemented in practical engineering projects [9]. However, the traditional LEMs require two preconditions: slice division and inter-slice force assumption. The number of slices determines the number of mechanical equilibrium equations, affecting the precision of the calculations [10]. Additionally, the reasonableness of the assumptions regarding the relationship between inter-slice forces and the positions of their action points directly influences the accuracy of the slope stability analysis results, leading to variations in outcomes obtained by different LEM approaches.
The failure of rock slopes must adhere to the corresponding strength criterion. In triaxial experiments, rock masses often exhibit nonlinear damage characteristics [11, 12]. To describe the failure behavior of rock masses, HOEK and BROWN [13] proposed a nonlinear generalized Hoek-Brown (GHB) strength criterion, widely used in rock mass analysis. In slope stability analysis using the nonlinear GHB strength criterion, various approaches are employed to calculate the factor of safety (FOS) of slopes. One approach involves constructing the linear equivalent Mohr-Coulomb (M-C) strength parameters. This linearization process utilizes the principle of equal area coverage of the strength envelope [14], making rock slope stability analysis more straightforward. The second approach involves applying the single-point tangent method to homogenize the shear strength parameters of the rock mass on the slip surface (SS). These homogenized values are then considered as tangent strength parameters at a specific point on the nonlinear GHB strength envelope [15]. The third approach involves applying the NSMs to obtain the major and minor principal stresses of the slope. These values are then used to calculate the shear strength of each part of the slope based on a nonlinear strength criterion under the principal stress expression [16]. The first two treatments for the nonlinear GHB strength criterion fail to establish a direct link between the stresses and strength parameters on the SS. For the third treatment, although numerical simulations can account for nonlinear stress-strength relationships, they are challenging to apply to strength criterion for non-principal stress expressions. Reliable slope stability analysis requires not only the incorporation of the nonlinear strength criterion but also the effective revelation of the tension- and compression-shear damage behavior of slope. Existing examples of rock landslides indicate that the slope collapse typically occurs due to the failure of the rock mass through tension- and compression-shear [17]. Despite theoretical analysis methods for slope stability can effectively capture compression-shear failure, they often struggle to accurately detect tension-shear failure. To address this issue, the NSM obtains the tension-shear stress zone by solving the slope stress field, allowing for the visual identification of the tension-shear stress zone. However, the accuracy of numerical simulations can be affected by factors such as the artificial mesh division of the numerical model. For the LAM, it enhances the strength criterion and indirectly represents the features of slope tension-shear damage by introducing a tensile cut-off [18]. However, this approach does not entirely elucidate the underlying mechanism responsible for slope tension-shear failure. For the traditional LEMs, they can only assess slope stability from a macroscopic perspective, making it challenging to accurately detect slope tension-shear failure. This difficulty arises because it is complex to illustrate the local features of stresses on the SS in slide mechanics analysis under the assumption of inter-slice forces.
To address the challenges of incorporating the nonlinear GHB strength criterion and revealing the tension- and compression-shear damage behavior of slopes, researchers have focused on calculating the normal stress (NS) on the SS [19] and established the LEMs for slope stability based on the SS stress calculation model. In 1968, BELL [20] introduced two correction variables to incorporate the NS on the SS as a function that includes correction terms for the slice volume force and the inter-slice forces. BELL utilized the mechanical equilibrium condition of the sliding body to solve the slope FOS. In 2009, ZHU and THAM [21] argued against correcting the slice volume force in the Bell’s function for the NS on the SS. They proposed dividing the NS on the SS into two parts: the foundational NS and the additional NS. Building on this, DENG et al [22] proposed a similar method using the LE approach for slope stability analysis and presented a simplified function for the NS on the SS. However, the functions for the NS on the SS proposed by the aforementioned researchers still exhibit certain limitations. These limitations mainly revolve around two aspects: 1) the consideration of the additional NS term involves subjectivity judgment, and 2) incorporating the slope’s tension- and compression-shear failure characteristics into the function proves challenging. To tackle the issue of undetermined parameters in a function of the NS on the SS, a combination of mechanical equilibrium equations and boundary conditions satisfied by the sliding body is required. Currently, existing LEMs for slope stability analysis that involve stress calculation on the SS still rely on the traditional approach. This approach solely relies on the mechanical equilibrium equations satisfied by the sliding body to solve the pending parameters within the NS function on the SS, without incorporating the stress constraint conditions at both ends of the SS (i.e., boundary conditions). However, incorporating the stress constraint conditions at both ends of the SS offers several advantages. Firstly, it improves the accuracy and strictness of stress solution on the SS. Secondly, it helps reveal the shear failure characteristics of the slope indicated by the stress information on the SS. In the theory of slope stability analysis, the variational method considers the boundary conditions at the end of the SS, which partly indicates the tension-shear behavior of the SS. It is worth noting that the mathematical equations used in the variational method, which introduces boundary conditions of the SS to find the extreme value, lack physical mechanics meaning and are not easily applicable in other methods. Additionally, the stress information expressed at the end of the SS may not be highly reliable. Therefore, there is a need to establish the generalized stress constraint conditions at both ends of the SS that have clear physical meaning.
In this study, an improved LEM is proposed for analyzing the stability of rock slopes by focusing on the calculation of the stresses on the SS. The main contribution of the present method lies in the development of a rational function for the NS on the SS. To achieve this, the Taylor series is utilized to approximate the unknown NS term. Furthermore, the shear stress on the SS is determined by combining the NS on the SS with the slope FOS definition, which incorporates the nonlinear GHB strength criterion. This integration creates a mutual feedback mechanism between the stresses and strength parameters of the SS. To ensure a clear physical and mechanical interpretation, stress constraint conditions are introduced at both ends of the SS using the spatial stress relation of one point. By satisfying the overall mechanical equilibrium equations of the sliding body and the stress constraint conditions at both ends of the SS, the slope FOS and the stress solution for the SS can be deduced. The validity of the proposed NS function on the SS is verified through a comparative analysis of several slope examples, demonstrating its validity. Moreover, the feasibility of the slope stability analysis results is demonstrated, including the effective simulation of tension-shear stress zone of the SS near the slope top and the intuitive description of the concentration effect of compression-shear stress of the SS at the slope toe. Additionally, the present method exhibits superiority over the equivalent M-C strength parameter method and single-point tangent method when processing the embedded nonlinear GHB strength criterion.
2 LE solutions for rock slope stability under stress-based calculation mode for the slip surface
2.1 LE analysis model on stability of rock slope
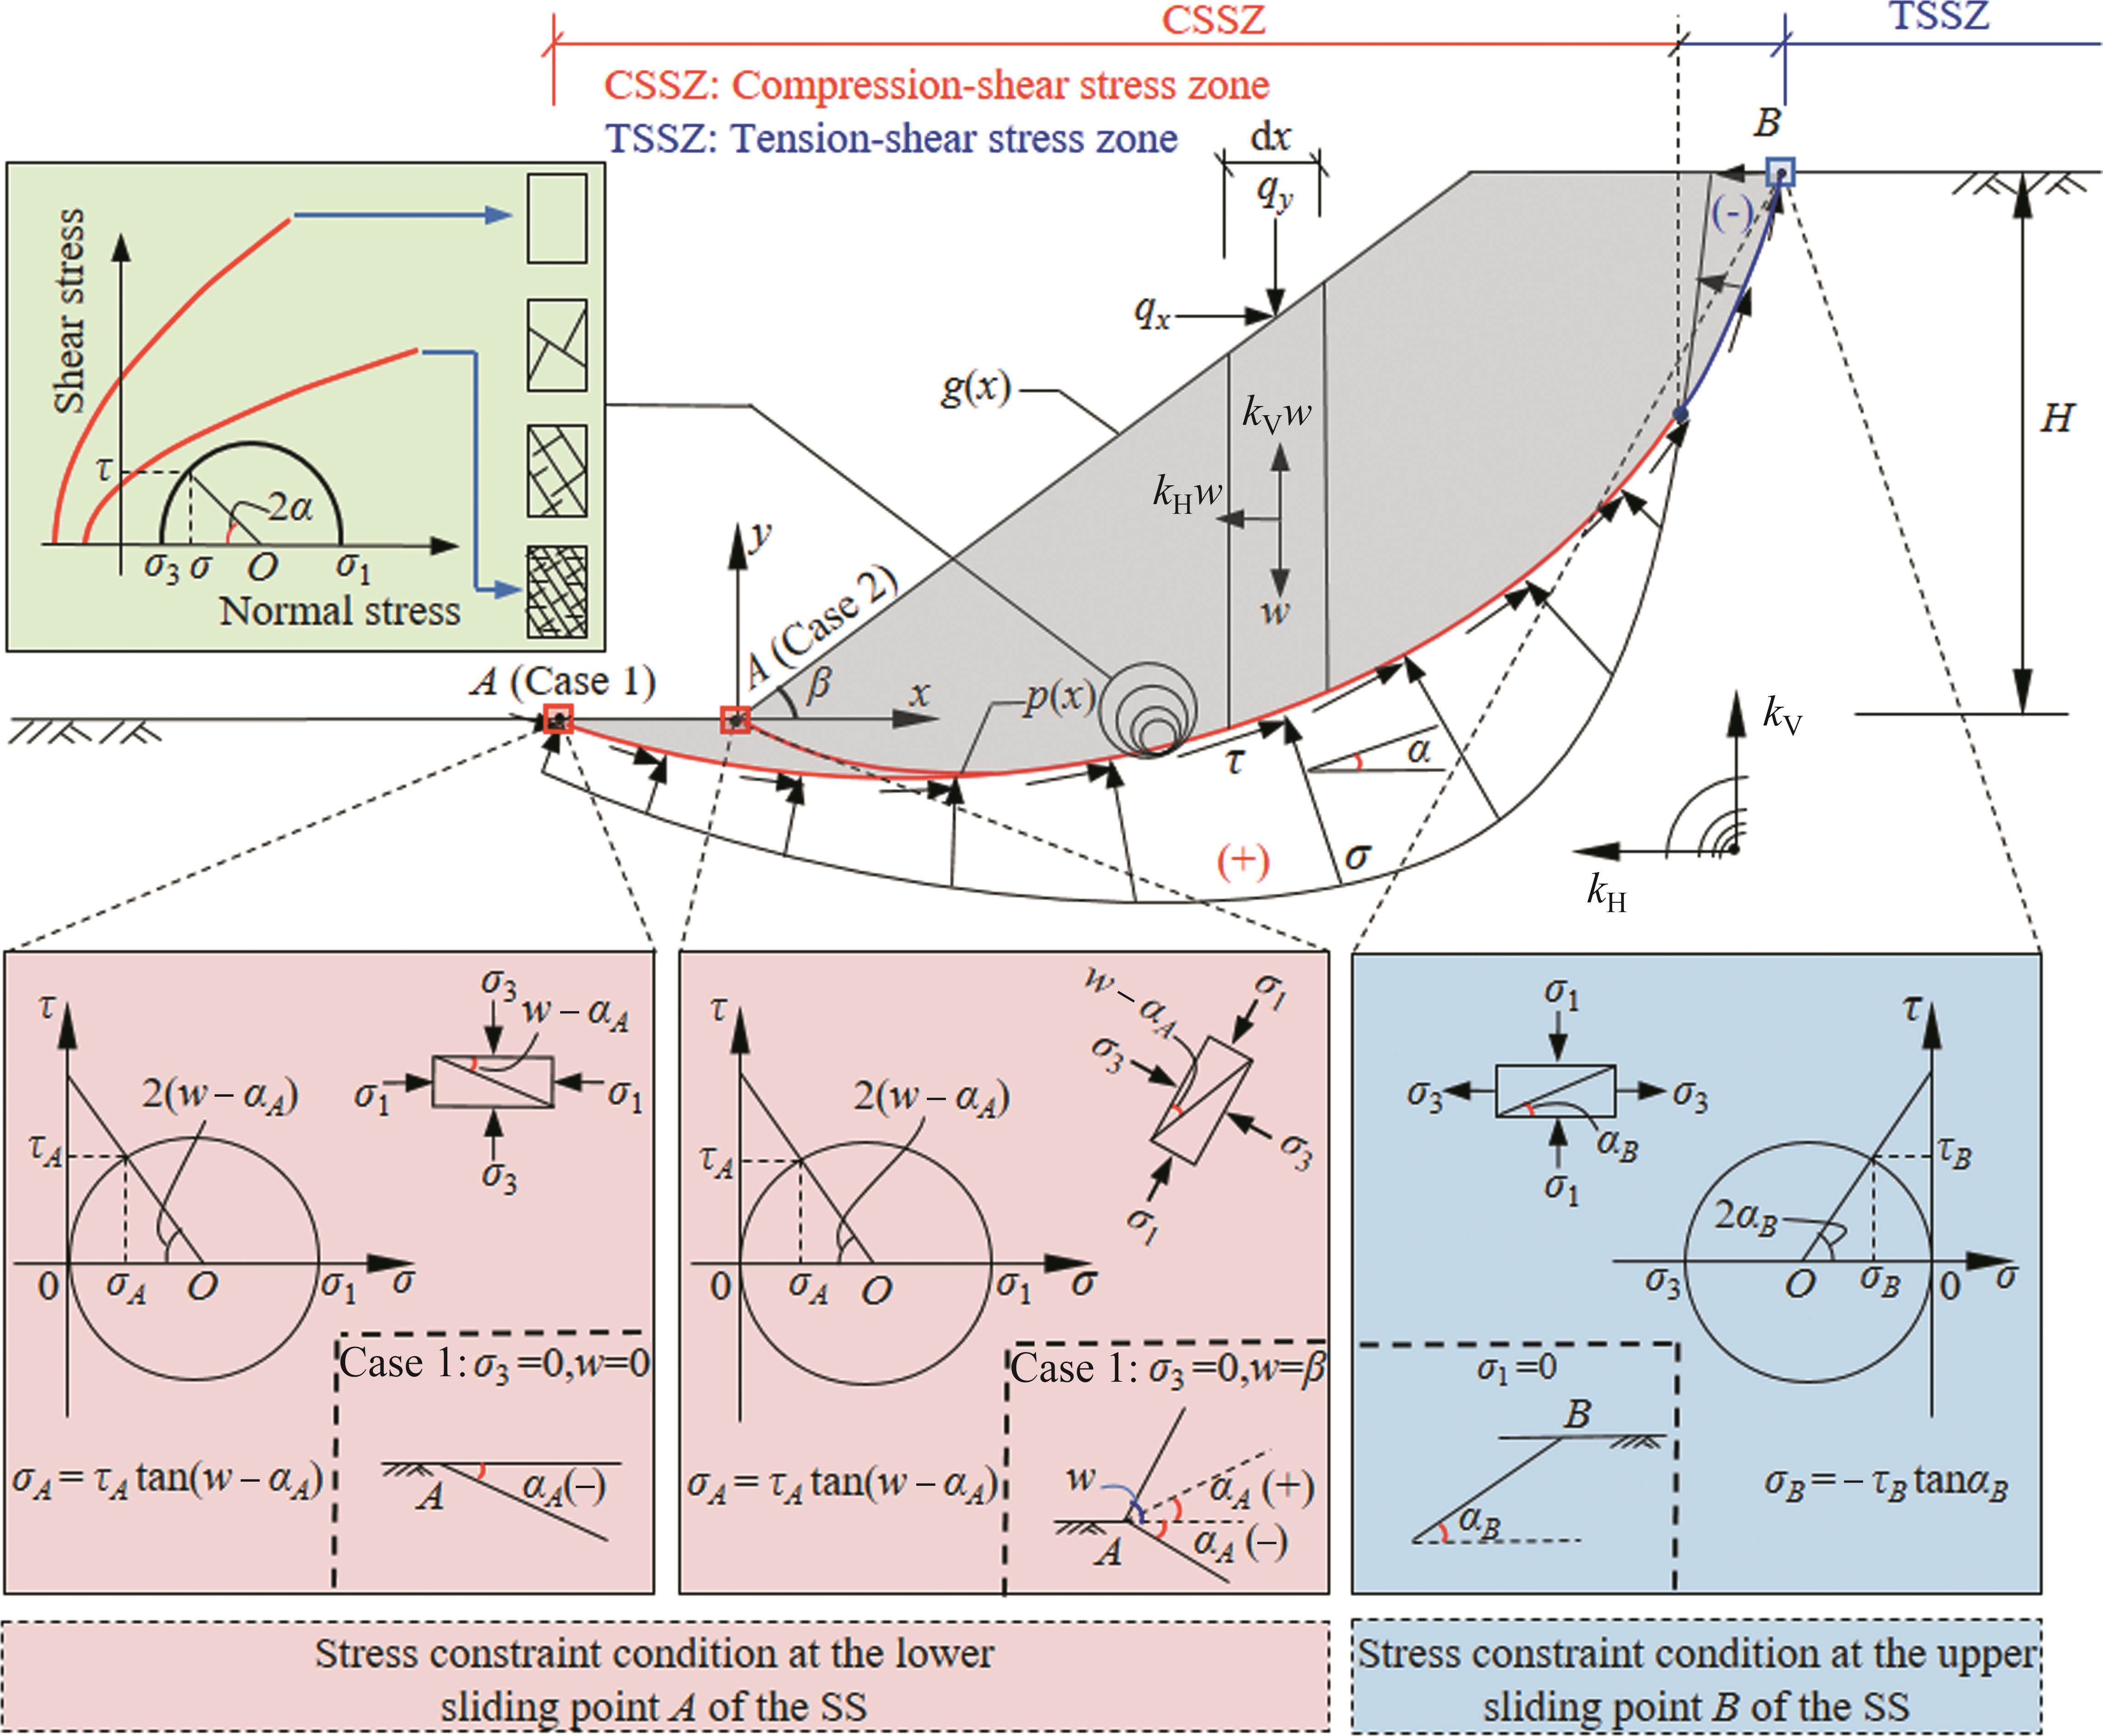
Figure 1 illustrates the LE analysis model used to assess the stability of rock slopes by employing the stress-based calculation mode for the SS. In this figure, various elements are represented as follows: the height of the slope H, the slope angle β, and the curved line AB signifies the SS, with point A being the lower sliding point and point B being the upper sliding points. It is crucial to note that the location of point A can either be on the horizontal plane outside the slope toe (referred to as Case 1 in Figure 1) or on the slope surface inside the slope toe (referred to as Case 2 in Figure 1). As a result of differing boundary conditions in these two cases, the outcomes will differ as well. To establish a suitable coordinate system, an xy-axis is adopted, with the slope toe as the origin. This enables the expression of the slope surface equation as y=g(x), and the SS equation as y=p(x). When analyzing a vertical micro-slice with a width of dx within the sliding body of the slope, various forces come into play. These forces include the gravity force (wdx), horizontal and vertical seismic forces (kHwdx and kVwdx), horizontal and vertical loads on slope (qxdx and qydx), as well as the normal and shear forces acting on the SS (σdx/cosα and τdx/cosα). In the above parameters, the gravity per unit width of the micro-slice is denoted as w, and it can be calculated using the equation w=γ(g-p), where γ represents the gravity of the rock mass. Additionally, kH and kV are coefficients for horizontal and vertical seismic forces, respectively. kH is considered positive when the horizontal seismic force acts outward from the slope, and kV is positive when the vertical seismic force opposes the force of gravity. Furthermore, qx and qy represent the horizontal and vertical uniform forces, respectively, acting on the slope surface of the micro-slice. σ and τ represent the NS and shear stress on the SS, respectively. Near the slope top, there exists a zone where tension-shear stress occurs on the SS, resulting in a negative NS. The height of the tension-shear stress zone on the SS near the slope top is denoted as HT. Lastly, α represents the horizontal inclination angle of the tangent line to the SS in the micro-slice.
The traditional LEM is extensively used for slope stability analysis due to its simplicity and widespread application. It determines slope stability by considering the mechanics equilibrium conditions of individual slices [23-25]. However, as research progresses on slope failure characteristics, new complexities have been introduced, such as the nonlinear strength criterion. It has been discovered that the traditional LEM has limitations when analyzing slope stability and revealing slope failure characteristics under these complex factors. The main drawback lies in its reliance on the traditional method of slice division and assumptions about inter-slice forces. This approach fails to accurately capture crucial information about stress distribution along the SS, which hinders the proper recognition of underlying failure characteristics based on stress information. Consequently, the traditional LEM is inadequate for integration with the nonlinear strength criterion that takes stress information into account. Moreover, the assumption of inter-slice forces during the slice division is artificially determined, and its validity directly impacts the convergence of calculations and the reliability of results.
In summary, the traditional LEM is widely recognized for its simplicity and reliability in analyzing slope stability. However, it has limitations when it comes to assessing slope stability under complex factors and effectively identifying the failure characteristics. To address these challenges while maintaining the simplicity and reliability of the LEM, one promising approach to tackle these limitations is the adoption of a stress-based calculation mode for the SS. This mode establishes the stress functions on the SS as a prerequisite within the LE framework and solves the stresses on the SS and overall slope stability by considering the mechanical equilibrium conditions of the sliding body. It also allows for the incorporation of nonlinear strength criterion [26]. Nevertheless, the existing methods often establish arbitrary stress functions on the SS, lacking rigor and failing to fully capture the tension- and compression-shear failure characteristics of the SS [23, 24]. Hence, the main focus and challenge of the stress-based calculation mode lie in establishing rational stress functions on the SS that accurately represent its behavior.
In this study, to establish a rigorous and reasonable function for the NS on the SS, the Taylor series is employed to address the unknown portion of the NS on the SS. Furthermore, the function for the shear stress on the SS is formulated by incorporating the nonlinear GHB strength criterion and the definition of slope FOS. Additionally, the stress constraint conditions at both ends of the SS are introduced. As a result, the stress functions on the SS effectively capture the tension-shear characteristics near the slope top, as well as the concentration effect of the shear stress on the SS near the slope toe.
2.2 Normal stress function on slip surface
In Figure 1, the NS on the SS consists of two components: the fundamental NS and the additional NS, as described in Ref. [21]. The fundamental NS represents the stress attributable to the known forces within the sliding body, while the additional NS accounts for the stress due to unknown inter-slice forces. The primary contribution to the NS comes from the fundamental NS, with the additional NS playing a supplementary role. Furthermore, the fundamental NS is considered as the stress on a vertical micro-slice without considering inter-slice forces, and the additional NS is defined as a function that varies with the position of the slip surface. Consequently, the NS function on the SS is developed as follows:
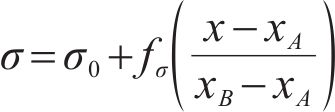
where σ0 represents the fundamental NS, calculated by analyzing mechanics equilibrium of vertical a micro-slice without considering inter-slice forces; fσ denotes the additional NS and it is a unknown function varying with the position of the SS; x represents the x-axis coordinate of the specific calculation point; and xA and xB represent the x-axis coordinates of the lower and upper sliding points A and B, respectively.
By examining the mechanical equilibrium of a vertical micro-slice and ignoring the inter-slice forces, it is possible to compute the fundamental NS (σ0) in Eq. (1) as follows:

Given that the additional NS has a smaller impact in comparison to the fundamental NS, and the independent variable (x-xA)/(xB-xA) in the additional NS function is limited to the range of [0, 1]. A Taylor series expansion is utilized to refine the undetermined additional NS function in Eq. (1) at point x=xA. This process results in the following refined expression as:
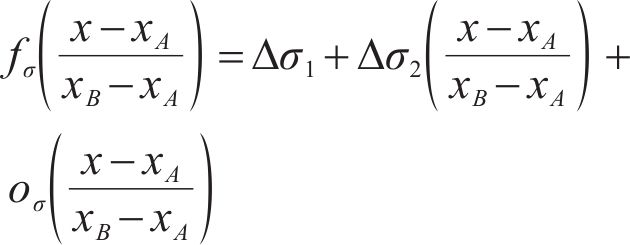
where Δσ1, Δσ2[(x-xA)/(xB-xA)], and oσ[(x-xA)/(xB-xA)] represent the constant term, the first-order term, and the error residual term, respectively, in the Taylor series expansion of the additional NS; and Δσ1 and Δσ2 are the variables to calculate the NS on the SS, measured in units of kPa.
In Eq. (3), the error residual term oσ in the expansion represents the difference between the expanded additional NS and its original function. Even though the additional NS accounts only a small portion to the NS on the SS, and the error residual term has a smaller impact compared to the constant and first-order terms, completely neglecting the error residual term in the Taylor series expansion equation would inevitably undermine the reliability of the calculation results. To address this issue, an approximate calculation formula is introduced to substitute the error residual term in the expansion equation:
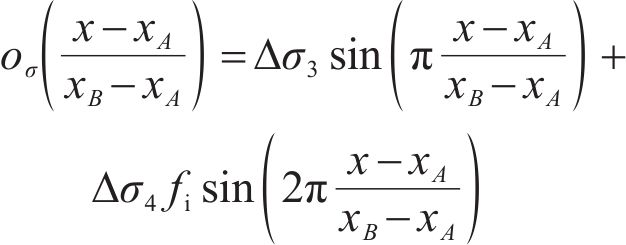
where Δσ3 and Δσ4 are the variables to calculate the NS on the SS, measured in units of kPa; and fi is a dimensionless parameter used to ensure the calculation convergence and the rationality of the NS solution on the SS, and the relevant formulas and their corresponding meanings are provided in the subsequent calculation of the variable Δσ3.
It is important to note that the utilization of the sine function to approximate the error residual term is based on two primary reasons. Firstly, following the Fourier transform, the present method employs linear combinations of two sine functions with different periods to approximate the error residual term. By utilizing the positive and negative values of the sine function, the error residual term effectively refines the constant and first-order terms of the additional NS expansion equation and reveals both positive and negative impacts of unknown inter-slice forces on the NS with intricate variations. Secondly, the sine function possesses a boundary value of 0 within its period, with the total integral sum also being 0. This particular trait allows the calculation variables in the NS function on the SS to be relatively independent, thus aiding in the convergence of the calculation results.
By incorporating these properties into the approximated formula, it becomes possible to achieve more precise calculations for the error residual term. Then, through integrating Eqs. (1), (3), and (4), the NS function on the SS can be formulated as follows:

2.3 Shear stress function on the slip surface under nonlinear GHB Strength criterion
In the analysis of slope stability, the shear stress on the SS is commonly expressed as the ratio of the shear strength of the SS to the slope FOS. Therefore, the calculation of shear stress on the SS depends on the chosen shear strength criterion.
When dealing with rock slopes, the nonlinear GHB strength criterion offers a more accurate representation of the shear failure behavior of rock masses. Hence, this study adopts the nonlinear GHB strength criterion to analyze the stability of rock slopes. Initially proposed by HOKE and BROWN [13], the nonlinear GHB strength criterion utilizes the major and minor principal stresses to illustrate the shear failure behavior of rock masses. Subsequently, KUMAR [27] modified the initial nonlinear GHB strength criterion equation by incorporating the relationship between the Mohr stress circle and the yield surface of the shear strength of the rock mass. As a result, a revised formula was established under the nonlinear GHB strength criterion, where the NS on the SS is considered as a variable. Furthermore, the instantaneous internal friction angle of the rock mass related to the NS can be calculated based on the known NS.
The equation provided by KUMAR [27] is:
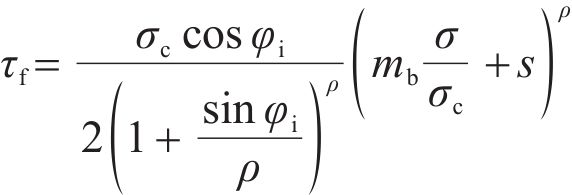
where τf represents the shear strength of the rock mass; σ denotes the NS acting on the rock mass; σc is the uniaxial compressive strength of an intact rock; mb is the material constant; s is a parameter that reflects the degree of rock fragmentation (ranging between 0.0 and 1.0); ρ is a constant related to the structure of the rock mass and the characteristics of the joint surface; and φi is the horizontal inclination angle of tangent line of the yield surface of shear strength of the rock mass under the NS (σ), which is typically defined as the instantaneous internal friction angle of the rock mass related to the NS [28].
In Eq. (6), the parameters of mb, s and ρ are related to the geological strength index (GSI), and their calculation formulas are listed in Appendix 1. When assuming a τf value of 0 and considering that both positive and negative stress signs indicate compression or tension of the rock mass, the tensile strength (σt) of the rock mass under the nonlinear GHB strength criterion can be determined as follows:

Moreover, the instantaneous internal friction angle (φi) of the rock mass must adhere to a specified relationship, which has been rearranged in this study as follows:

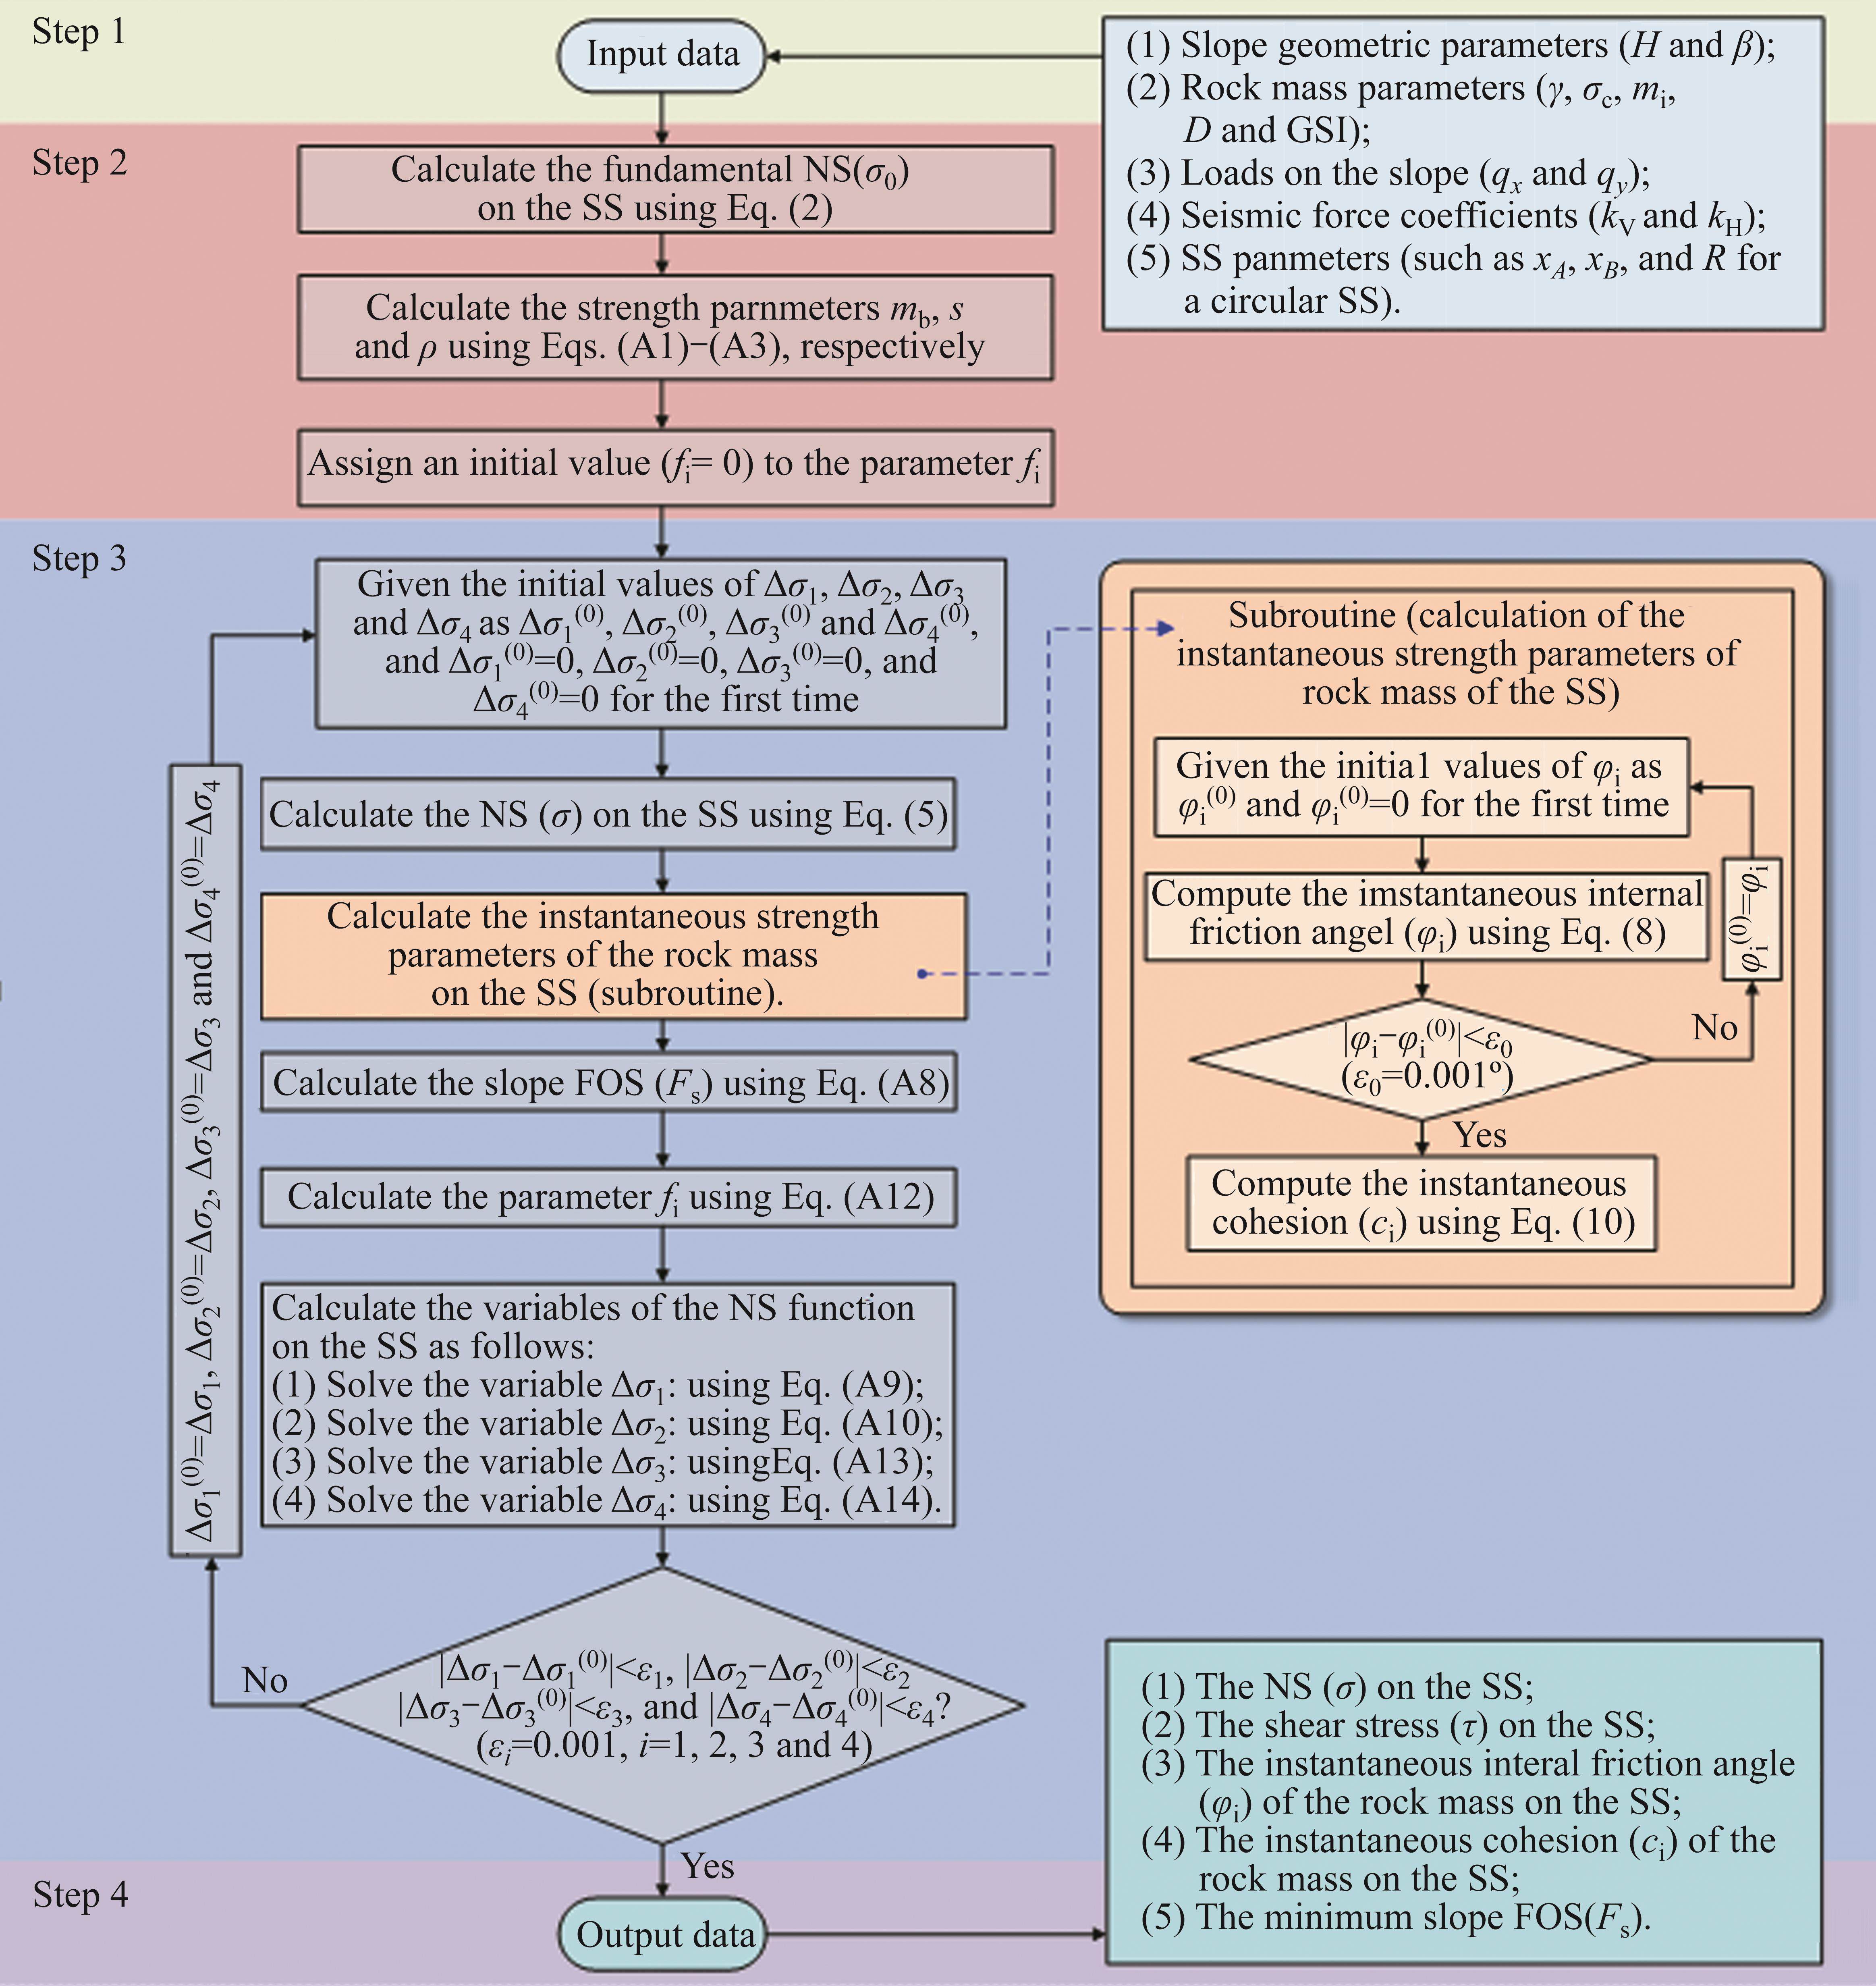
By utilizing Eq. (7), the instantaneous internal friction angle (φi) of a rock mass can be determined under the corresponding NS (σ) through an iterative cyclic calculation strategy. The calculation process can be found in the subroutine of “calculation of the instantaneous strength parameters of rock mass of the SS” in Figure 2.
Previous research conducted by SHEN et al [29] in 2012 suggests that the tangent line of the yield surface of the nonlinear GHB shear strength criterion under the NS (σ) can be employed to determine the instantaneous strength parameters of a rock mass. These parameters are then utilized to reflect the mechanical behavior of the rock mass with nonlinear stress-dependent shear strength. Consequently, the shear strength at any point on the yield surface of the nonlinear GHB strength criterion encompasses two distinct components: ci and σtanφi. Here, ci represent the intercept of the tangent line on the shear stress axis and corresponds to the instantaneous cohesion of the rock mass associated with the NS (σ).
Thus, the shear strength of the rock mass can be determined as follows:

where

Equation (9) mentioned in the text exhibits similarities to the linear M-C strength criterion in its expression. However, it differs in that the parameters φi and ci depend on the NS (σ) on the SS and are considered as variables. Therefore, in order to calculate the values of φi and ci based on the nonlinear GHB strength criterion described in Eq. (9), it is necessary to have information about the NS on the SS, and this calculation can be performed through computer programming. The steps for calculating the instantaneous strength parameters of the rock mass on the SS are outlined in the subroutine “calculation of instantaneous strength parameters of rock mass on the SS” in Figure 2. From the calculation steps, it can be observed that the instantaneous strength parameters (φi and ci) of the rock mass at different positions on the SS vary based on the differences in the NS (σ) on the SS. This approach provides a more accurate representation of the local characteristics for the stress level on the SS, compared to the commonly used linearization method of strength parameters under the nonlinear GHB strength criterion.
Based on the information provided above, the shear stress on the SS can be expressed as a ratio between the shear strength of the SS and the slope FOS. By combining Eqs. (5) and (9), the function for calculating the shear stress on the SS is then derived as follows:

where Fs is the slope FOS.
2.4 Stress constraint conditions at both ends of the slip surface
As depicted in Figure 1, both the lower sliding point A and the upper sliding point B are situated on both the SS and the slope surface. By utilizing the Mohr stress circle and considering the spatial stress relationship of one point, a correlation between the NS and shear stress on the SS can be established. This correlation is based on the known stress information of the lower sliding point A and the upper sliding point B on the slope surface, thus providing the stress constraint conditions at both ends of the SS. Examining the stress constraint conditions at both ends of the SS delivers valuable insights into the failure characteristics of the SS. This includes indentifying the occurrence of tension-shear failure near the slope top and understanding the stress concentration effect of the SS near the slope toe.
When referring to Figure 1, without considering slope loading at point A, the relationship between the NS (σA) and the shear stress (τA) on the SS can be determined using the Mohr stress circle. The relationship can be expressed as follows:

where αA represents the horizontal inclination angle of the tangent to the SS at point A; and ω refers to the slope angle associated with point A.
As the shear stress of the SS at the lower sliding point A is positive, the NS on the SS at point A is also positive (i.e., σA>0) according to Eq. (12). Furthermore, when αA approaches ω in Eq. (12), indicating that the tangent of the SS is close to the slope surface, the shear stress (τA) tends to approach infinity when σA>0. This suggests a significant increase in the shear stress near the slope toe, rendering the rock mass more vulnerable to compression-shear failure. In practical scenarios, the noticeable increase in shear stress near the slope toe is a result of the shear stress concentration effect caused by the slide shear exit wedge.
This study strongly emphasizes the need to incorporate this phenomenon into consideration by ensuring the stress constraint condition been satisfied at the lower sliding point A of the SS. By addressing this limitation, an improvement can be made in the existing LEM, which otherwise fails to account for this specific issue.
Similarly, when referring to Figure 1, the relationship between the NS (σB) and the shear stress (τB) on the SS, without considering slope loading at point B, can be expressed as follows:

where αB represents the horizontal inclination angle of the tangent to the SS at point B.
In Eq. (13), it is evident that the SS at point B undergoes a positive shear stress (τB) with a value of αB>0. Consequently, the NS (σB) on the SS at point B would be negative. It is important to note that the calculation of the NS on the SS is a continuous function denoted by Eq. (5). Therefore, it implies the NS on the SS in a specific area below point B will also be negative when σB<0. This observation indicates that the SS experiences a tension-shear state within a particular range near the slope top. Essentially, the tension-shear stress zone of the SS near the slope top can be identified using the present method by satisfying the stress constraint condition at the end of the SS for point B. This capability is also a limitation of the existing LEM, which cannot address this issue.
By substituting Eq. (11) into Eq. (13) and combining it with Eq. (9), the calculation formula for the NS on the SS at point B is derived as follows:
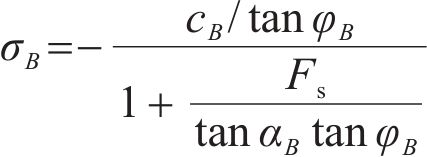
According to Eq. (14), it can be inferred that αB= 90° when σB=-cB/tanφB=-σt, implying that the SS near the slope top is parallel to the vertical direction. In this case, the tensile stress of the SS equals the tensile strength of the rock mass, resulting in cracking. This observation provides further support for the notion that the tension cracks at the slope top exhibit characteristics of vertical development, as described in references [30, 31].
A more detailed description of the NS and the shear stress on the SS at points A and B can be found in the Appendix 2.
2.5 Overall mechanical equilibrium equations of a sliding body
For the two-dimensional slope sliding body in the LE state, three static equilibrium equations must be fulfilled. These equations guarantee that the forces and moments acting on the sliding body are balanced. As depicted in Figure 1, the overall force equilibrium equations along the x- and y-axes, along with the overall moment equilibrium equation around the origin, are established for the sliding body as follows:


where p and g represent the SS equation p(x) and the slope surface equation g(x), respectively; and px signifies the first derivative of the SS equation p(x), with the specific value of px being equal to tanα.
2.6 LE solution and flow chart for LE analysis on rock slope stability under stress-based calculation mode for the slip surface
In the above analysis, the stress functions on the SS (Eqs. (5) and (11)) contain five unknown variables: Δσ1, Δσ2, Δσ3, Δσ4 and Fs. In addition to satisfying the three overall mechanical equilibrium equations in the slope sliding body, two extra stress constraint conditions are introduced at both ends of the SS. These conditions allow for the determination of the five unknown variables in the stress function on the SS one by one. The following outlines the specific process of applying the three overall mechanical equilibrium equations for the slope sliding body and the two stress constraint conditions at both ends of the SS, which are used to derive the calculation formulas for the five unknown variables in the stress function on the SS.
The implicit formulas for calculating the slope FOS (Fs) and the variables Δσ1, Δσ2, Δσ3 and Δσ4 are shown in Appendix 3. These formulas (i.e., Eqs. (A8), (A9), (A10), (A13) and (A14)) require iterative loop calculations in order to obtain solutions. The specific solution process for solving them is as follows (refer to Figure 2 for details steps): (1) start with initial values for Fs, Δσ1, Δσ2, Δσ3 and Δσ4, denoted as be Fs(0), Δσ1(0), Δσ2(0), Δσ3(0), and Δσ4(0), and set Fs(0)=1, Δσ1(0)=0, Δσ2(0)=0, Δσ3(0)=0, and Δσ4(0)=0 for the first calculation; (2) calculate the NS (σ) on the SS using Eq. (5), and determine the instantaneous strength parameters φi and ci of the rock mass of the SS based on the subroutine “calculation of the instantaneous strength parameters of rock mass of the SS”; (3) calculate the slope FOS (Fs) using Eq. (A8); (4) update the parameter fi using Eq. (A12); (5) calculate Δσ1, Δσ2, Δσ3 and Δσ4 using Eq. (A9), Eq. (A10), Eq. (A13) and Eq. (A14), respectively; (6) If |Δσ1-Δσ1(0)|


Figure 2 provides a detailed overview of the LE analysis process for rock slope stability under stress-based calculation mode for the SS. The process consists of four main steps: input data, calculation preparation, calculation execution, and output results. In the input data step, the necessary data include slope geometric parameters, rock mass parameters, slope load parameters, seismic coefficient, and SS parameters. These inputs are crucial for the analysis. During the calculation preparation, the mechanical parameters of the rock mass are transformed into values that are convenient for calculating the shear strength of the rock mass. Additionally, an initial value (fi=0) is assigned to the parameter fi, simplifying subsequent calculations. The calculation execution involves iterative cycles to calculate the slope FOS (Fs) and variables Δσ1, Δσ2, Δσ3 and Δσ4. The subroutine of “calculation of the instantaneous strength parameters of rock mass of the SS” is embedded within this process. In the output results step, the analysis provides the following results: slope FOS (Fs), NS (σ) on the SS, shear stress (τ) on the SS, instantaneous cohesion (ci), and instantaneous internal friction angle (φi).
In addition, by considering the above analysis process, one can select the slope SS parameters within a reasonable range. If the objective is to minimize the slope FOS, optimization methods or enumeration methods can be employed to search for the critical SS of the slope and determine the minimum slope FOS.
3 Verification of LEM for rock slope stability under stress-based calculation mode for the slip surface
As mentioned earlier, the traditional LEM for slope stability has certain limitations in integrating the nonlinear GHB strength criterion and understanding the characteristics of slope tension-shear failures. Therefore, the objective of this study is to address these issues by developing stress functions on the SS and incorporating the nonlinear GHB strength criterion. Additionally, in addition to ensuring the static equilibrium equations of the slope sliding body, stress constraint conditions are introduced at both ends of the SS to reflect the tension-shear failure characteristics of the slope. Consequently, an improved LEM is established for assessing the stability of rock slopes under the stress-based calculation mode for the SS.
3.1 Verification of rationality of stress functions on the slip surface
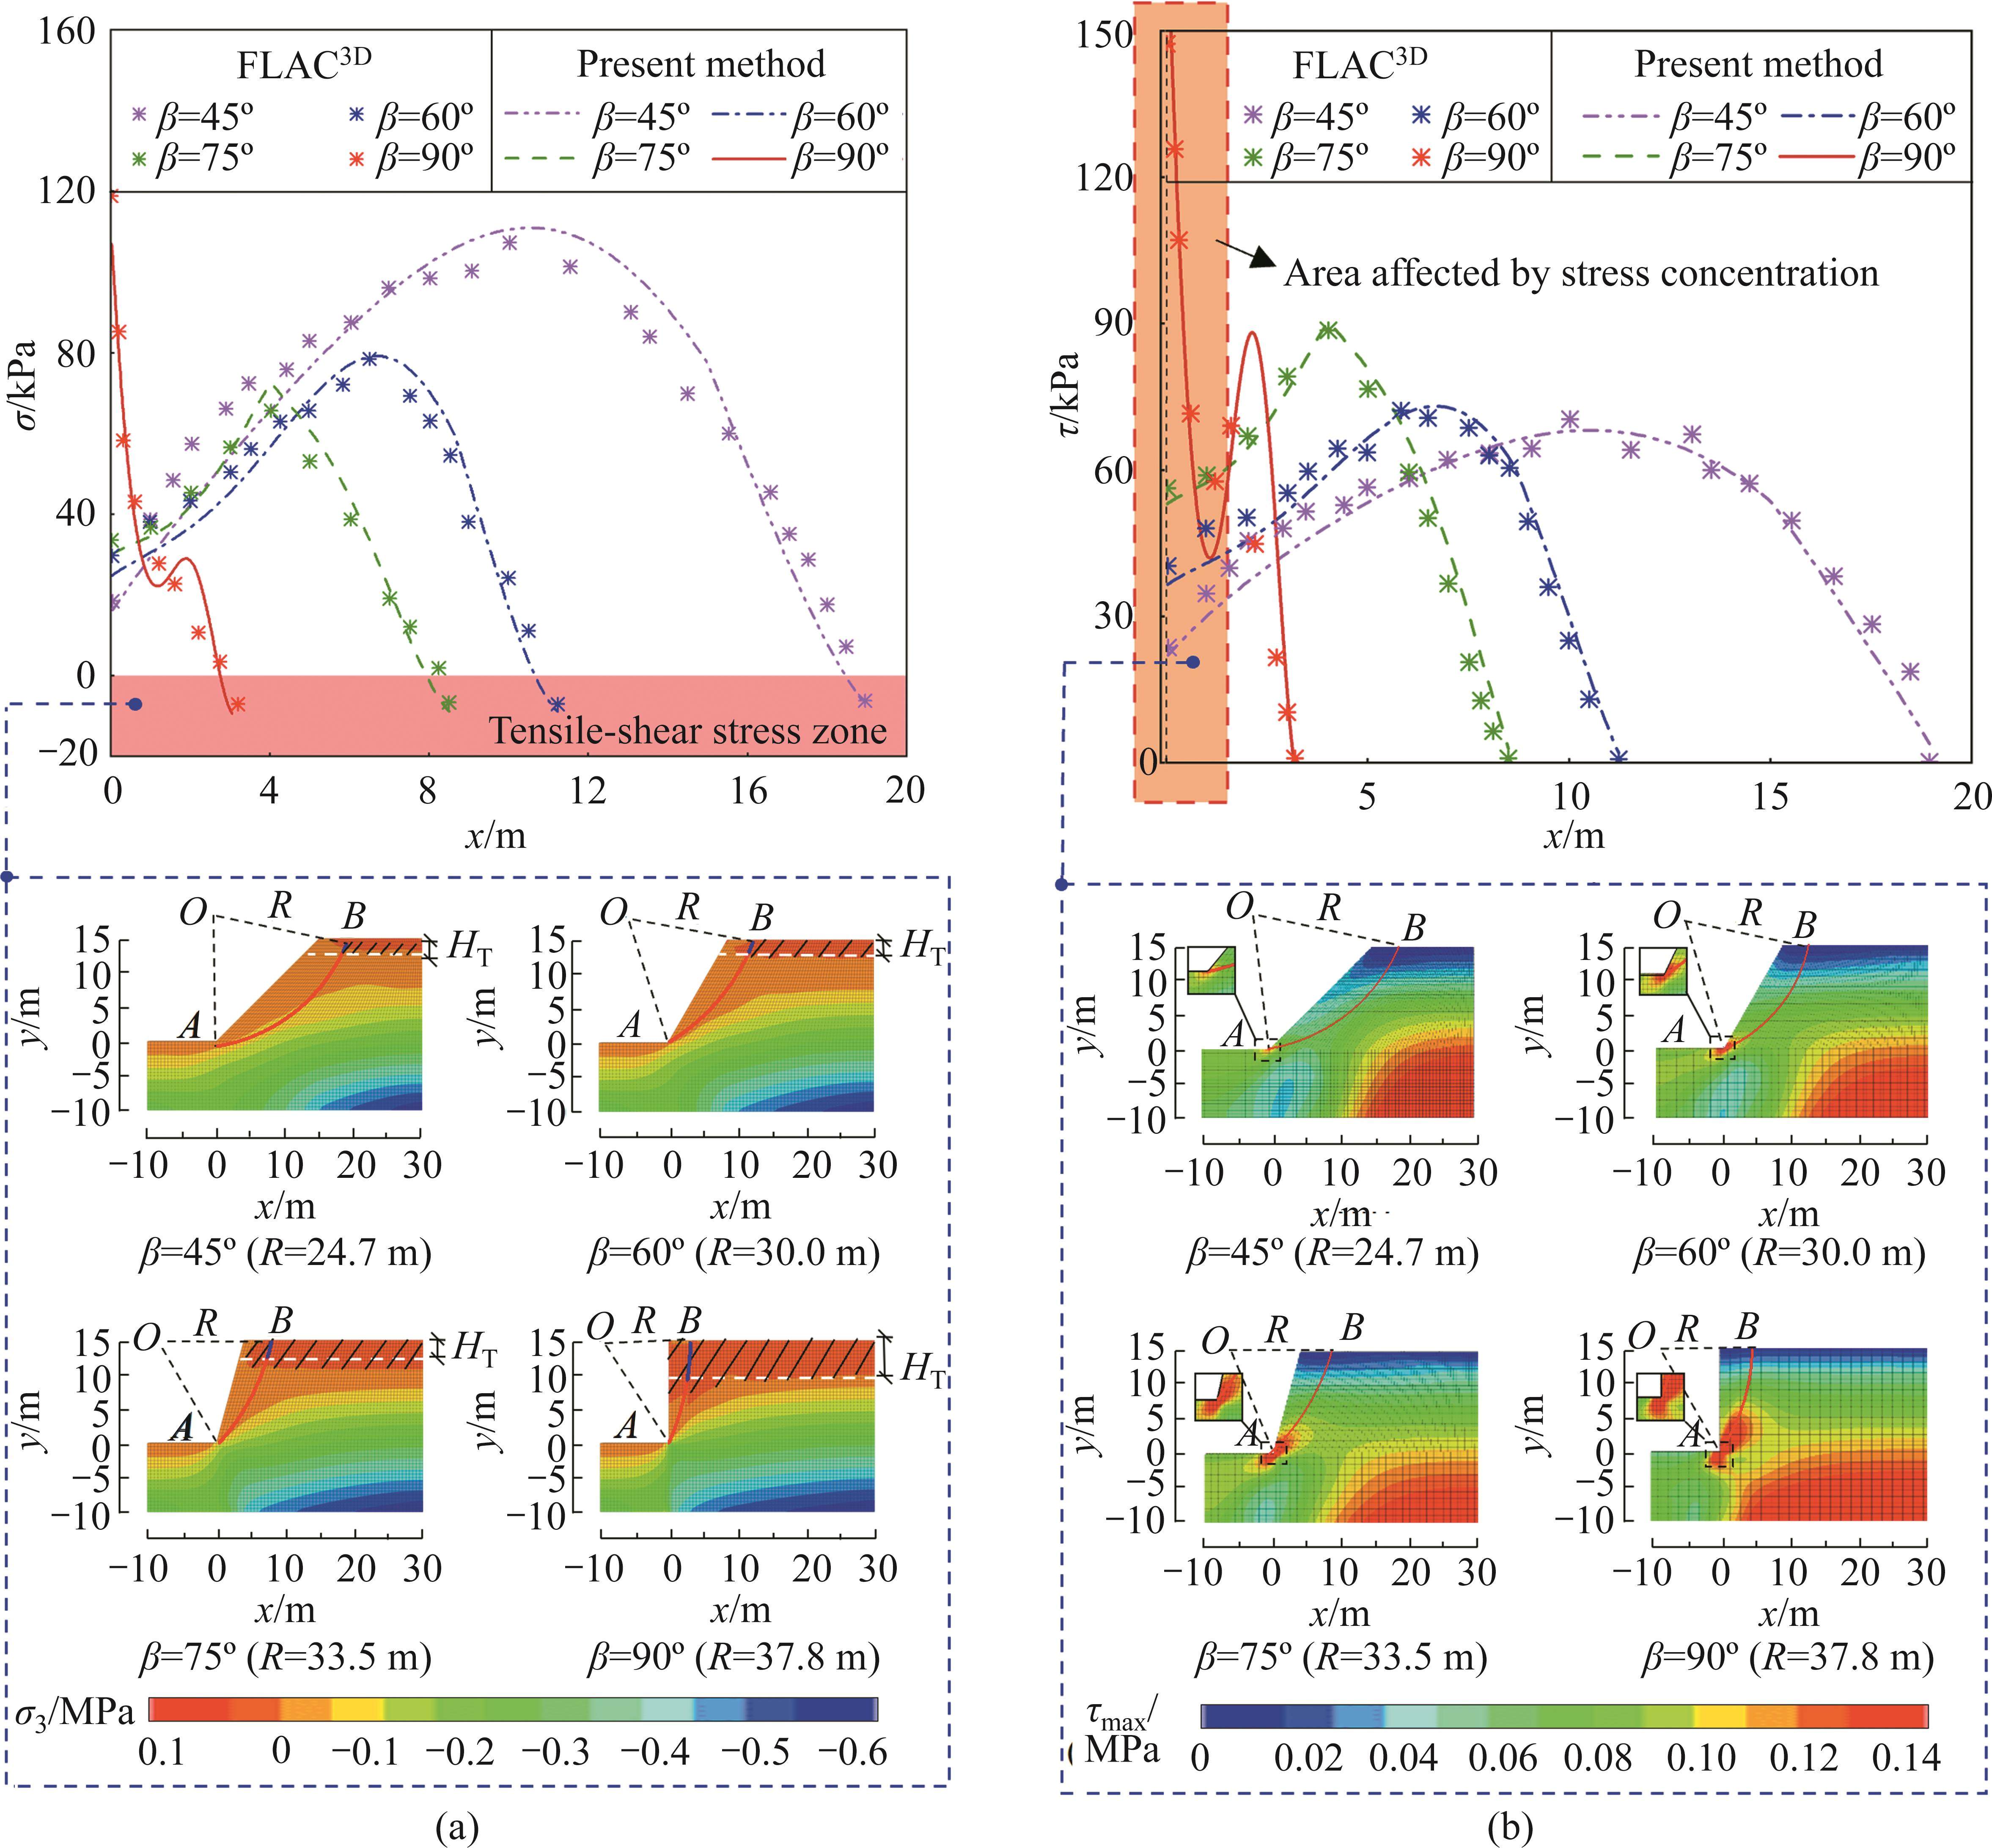
In this study, a homogeneous rock slope with a slope height (H) of 15 m is used as an example. The rock mass parameters considered for this slope include: γ=25 kN/m3, σc=5000 kPa, GSI=50, mi=12, and D=0. Figure 3 illustrates different slope angles (β) of 45°, 60°, 75° and 90° that were analyzed. The minimum slope FOS, along with the parameters defining the critical SS and the variables in the stress functions on the critical SS, are presented in Table 1.
| Case | Slope geometric parameters | Rock mass parameters | Minimum slope FOS | Critical SS parameters | Variables in stress functions on critical SS | ||||||||||
|---|---|---|---|---|---|---|---|---|---|---|---|---|---|---|---|
| H/m | β/(°) | γ/ (kN·m-3) | σc/kPa | GSI | mi | D | Fs_min | xA/m | xB/m | R/m | Δσ1/kPa | Δσ2/kPa | Δσ3/kPa | Δσ4/kPa | |
| 1 | 15 | 45 | 25 | 5000 | 50 | 12 | 0 | 2.719 | 0 | 18.5 | 24.7 | 18.23 | -25.56 | -0.3694 | -7.899 |
| 2 | 15 | 60 | 25 | 5000 | 50 | 12 | 0 | 2.325 | 0 | 12.16 | 30.0 | 23.69 | -31.70 | -6.882 | -24.35 |
| 3 | 15 | 75 | 25 | 5000 | 50 | 12 | 0 | 1.733 | 0 | 7.519 | 33.5 | 41.58 | -51.19 | -19.40 | -54.72 |
| 4 | 15 | 90 | 25 | 5000 | 50 | 12 | 0 | 1.221 | 0 | 5.813 | 37.8 | 73.60 | -85.23 | -39.44 | -97.57 |
To further explore the stress functions, distribution curves were generated to illustrate the NS and shear stress across the critical SS using the data from Table 1. In order to validate theoretical findings, a numerical model based on the theoretical slope model was developed using FLAC3D [32], a finite difference software. Through slope stability analysis and calculation of the stress field using FLAC3D, numerical results for NS and shear stress on the theoretical critical SS were obtained. Next, a comparison was made between the theoretical and numerical results of the stresses on the SS. This comparison aims to assess the reliability of the stress functions proposed in this study, Figure 3 depicts the small principal stress cloud diagram and the maximum shear stress cloud diagram of the slope, obtained from FLAC3D. These diagrams were utilized to verify the existence of the tension-shear stress zone near the slope top and the concentration of shear stress near the slope toe, as predicted by the stress functions on the SS in this study. It should be noted that the stress functions discussed in this study can only be applied in combination with the stress constraint conditions at both ends of the SS. This combination allows for the examination of the tension-shear zone near the slope top and the shear stress concentration effect near the slope toe on the SS.
From Figure 3, several observations can be made:
1) The stress distribution on the theoretical critical SS, obtained using the present method, shows a consistent overall trend compared to the results from NSM for different slope angles. The difference between the two methods is minimal.
2) The depth of the tension-shear stress zone near the slope top, as determined by the present method, closely matches that obtained through NSM. Both methods demonstrate that a steeper slope angle corresponds to a deeper tension-shear stress zone near the slope top.
3) The maximum shear stress cloud diagram derived from the numerical simulation analysis indicates a concentration of compression-shear stress within the rock mass near the slope toe. Furthermore, the concentration effect of compression-shear stress near the slope toe becomes more pronounced with an increase in slope angle.
4) The shear stress distribution curve of the SS, obtained through the present method, reveals that the shear stress near the slope toe is not zero. As the slope angle increases, the shear stress on the SS near the slope toe gradually increases. Importantly, when the slope angle reaches 90°, the shear stress on the SS near slope toe experiences a sudden increase.
5) Although there may be differences in the shear stress values on the SS obtained through the present method compared to the maximum shear stress values of the slope obtained through numerical simulation, the variation patterns related to the concentration effect of compression-shear stress near the slope toe remain consistent.
Based on the aforementioned analysis, it is evident that the stress functions on the SS proposed by this study yield the reliable stress results on the SS. Additionally, they effectively reproduces the tension-shear stress zone near the slope top and highlights the concentration effect of compression-shear stress near the slope toe. Thus, the validity of the stress functions on the SS in this study is confirmed.
3.2 Verification of reliability of embedding nonlinear GHB strength criterion into stress-based calculation mode for the slip surface
In the field of theoretical analysis methods for rock slope stability, there are various approaches to applying the nonlinear GHB strength criterion. One approach is to replace the nonlinear GHB strength criterion with the linear equivalent M-C (EMC) strength parameters [14], using the principle of equal coverage area of the strength envelope. Another approach, known as the single-point tangent method (proposed by DRESCHER and CHRISTOPOULOS in 1988) [15], estimates the overall uniform shear strength of the sliding body by using the tangent strength at a specific point on the nonlinear GHB strength envelope. However, neither of these approaches fully account for the nonlinear characteristics of the GHB strength criterion in rock slope stability analysis.
Incorporating the nonlinear characteristics of the GHB strength criterion into the stability assessment of rock slopes poses a challenge. Determining the strength parameters of the SS requires prior knowledge of the NS acting on the SS. However, to calculate the NS on the SS, slope stability analysis needs to be performed, assuming the strength parameters of the SS are known. Consequently, it is essential to create a mutual feedback mechanism between the stresses and strength parameters of the SS. In this study, the known fundamental NS in the NS function on the SS is utilized as the initial value for the NS on the SS. A loop iterative solution strategy is then employed to solve the stresses and strength parameters of the SS. The stresses and strength parameters of the SS are iteratively adjusted until the slope FOS indicates stability. By doing this, this study establishes an interaction mechanism between the stresses and strength parameters of the SS. Next, the study will compare the strength parameters of the SS obtained through the present method with those obtained using the EMC strength parameter method and the single-point tangent method. An illustrative example of a rock slope will be used for this analysis.
In Figure 4, an example of a homogeneous rock slope is shown, base on work by CHEN [33]. The slope has a slope height of H=108 m and a slope angle of β=60°. The rock mass parameters are as follows: γ=25 kN/m3, σc=30 MPa, GSI=65, mi=5, and D=0.0. The slope stability analysis is conducted using the present method, yielding the minimum slope FOS value of Fs_min=2.813. The critical SS parameters of the slope are xA=0 m, xB=92.35 m, and R=135 m. The variables in the NS function on the critical SS are calculated to be Δσ1=473.4 kPa, Δσ2=-902 kPa, Δσ3=92.31 kPa, and Δσ4=-761.2 kPa. Based on the EMC strength parameter method, the strength parameters of the rock mass are determined to be cEMC=1000.91 kPa and φEMC=38.52°. Using the single-point tangent method, the tangential strength parameters of the rock mass on the critical SS are estimated as csingle=859.56 kPa and φsingle=46.05°. In Figure 4, the distribution curves of the instantaneous internal friction angle and instantaneous cohesion of rock mass on the critical SS are plotted by using Eqs. (12) and (14). Point P represents a random point on the critical SS. As point P moves from the lower sliding point A to the upper sliding point B, the instantaneous internal friction angle and cohesion of the rock mass vary in response to the NS on the SS. These values are not fixed but change along the SS.
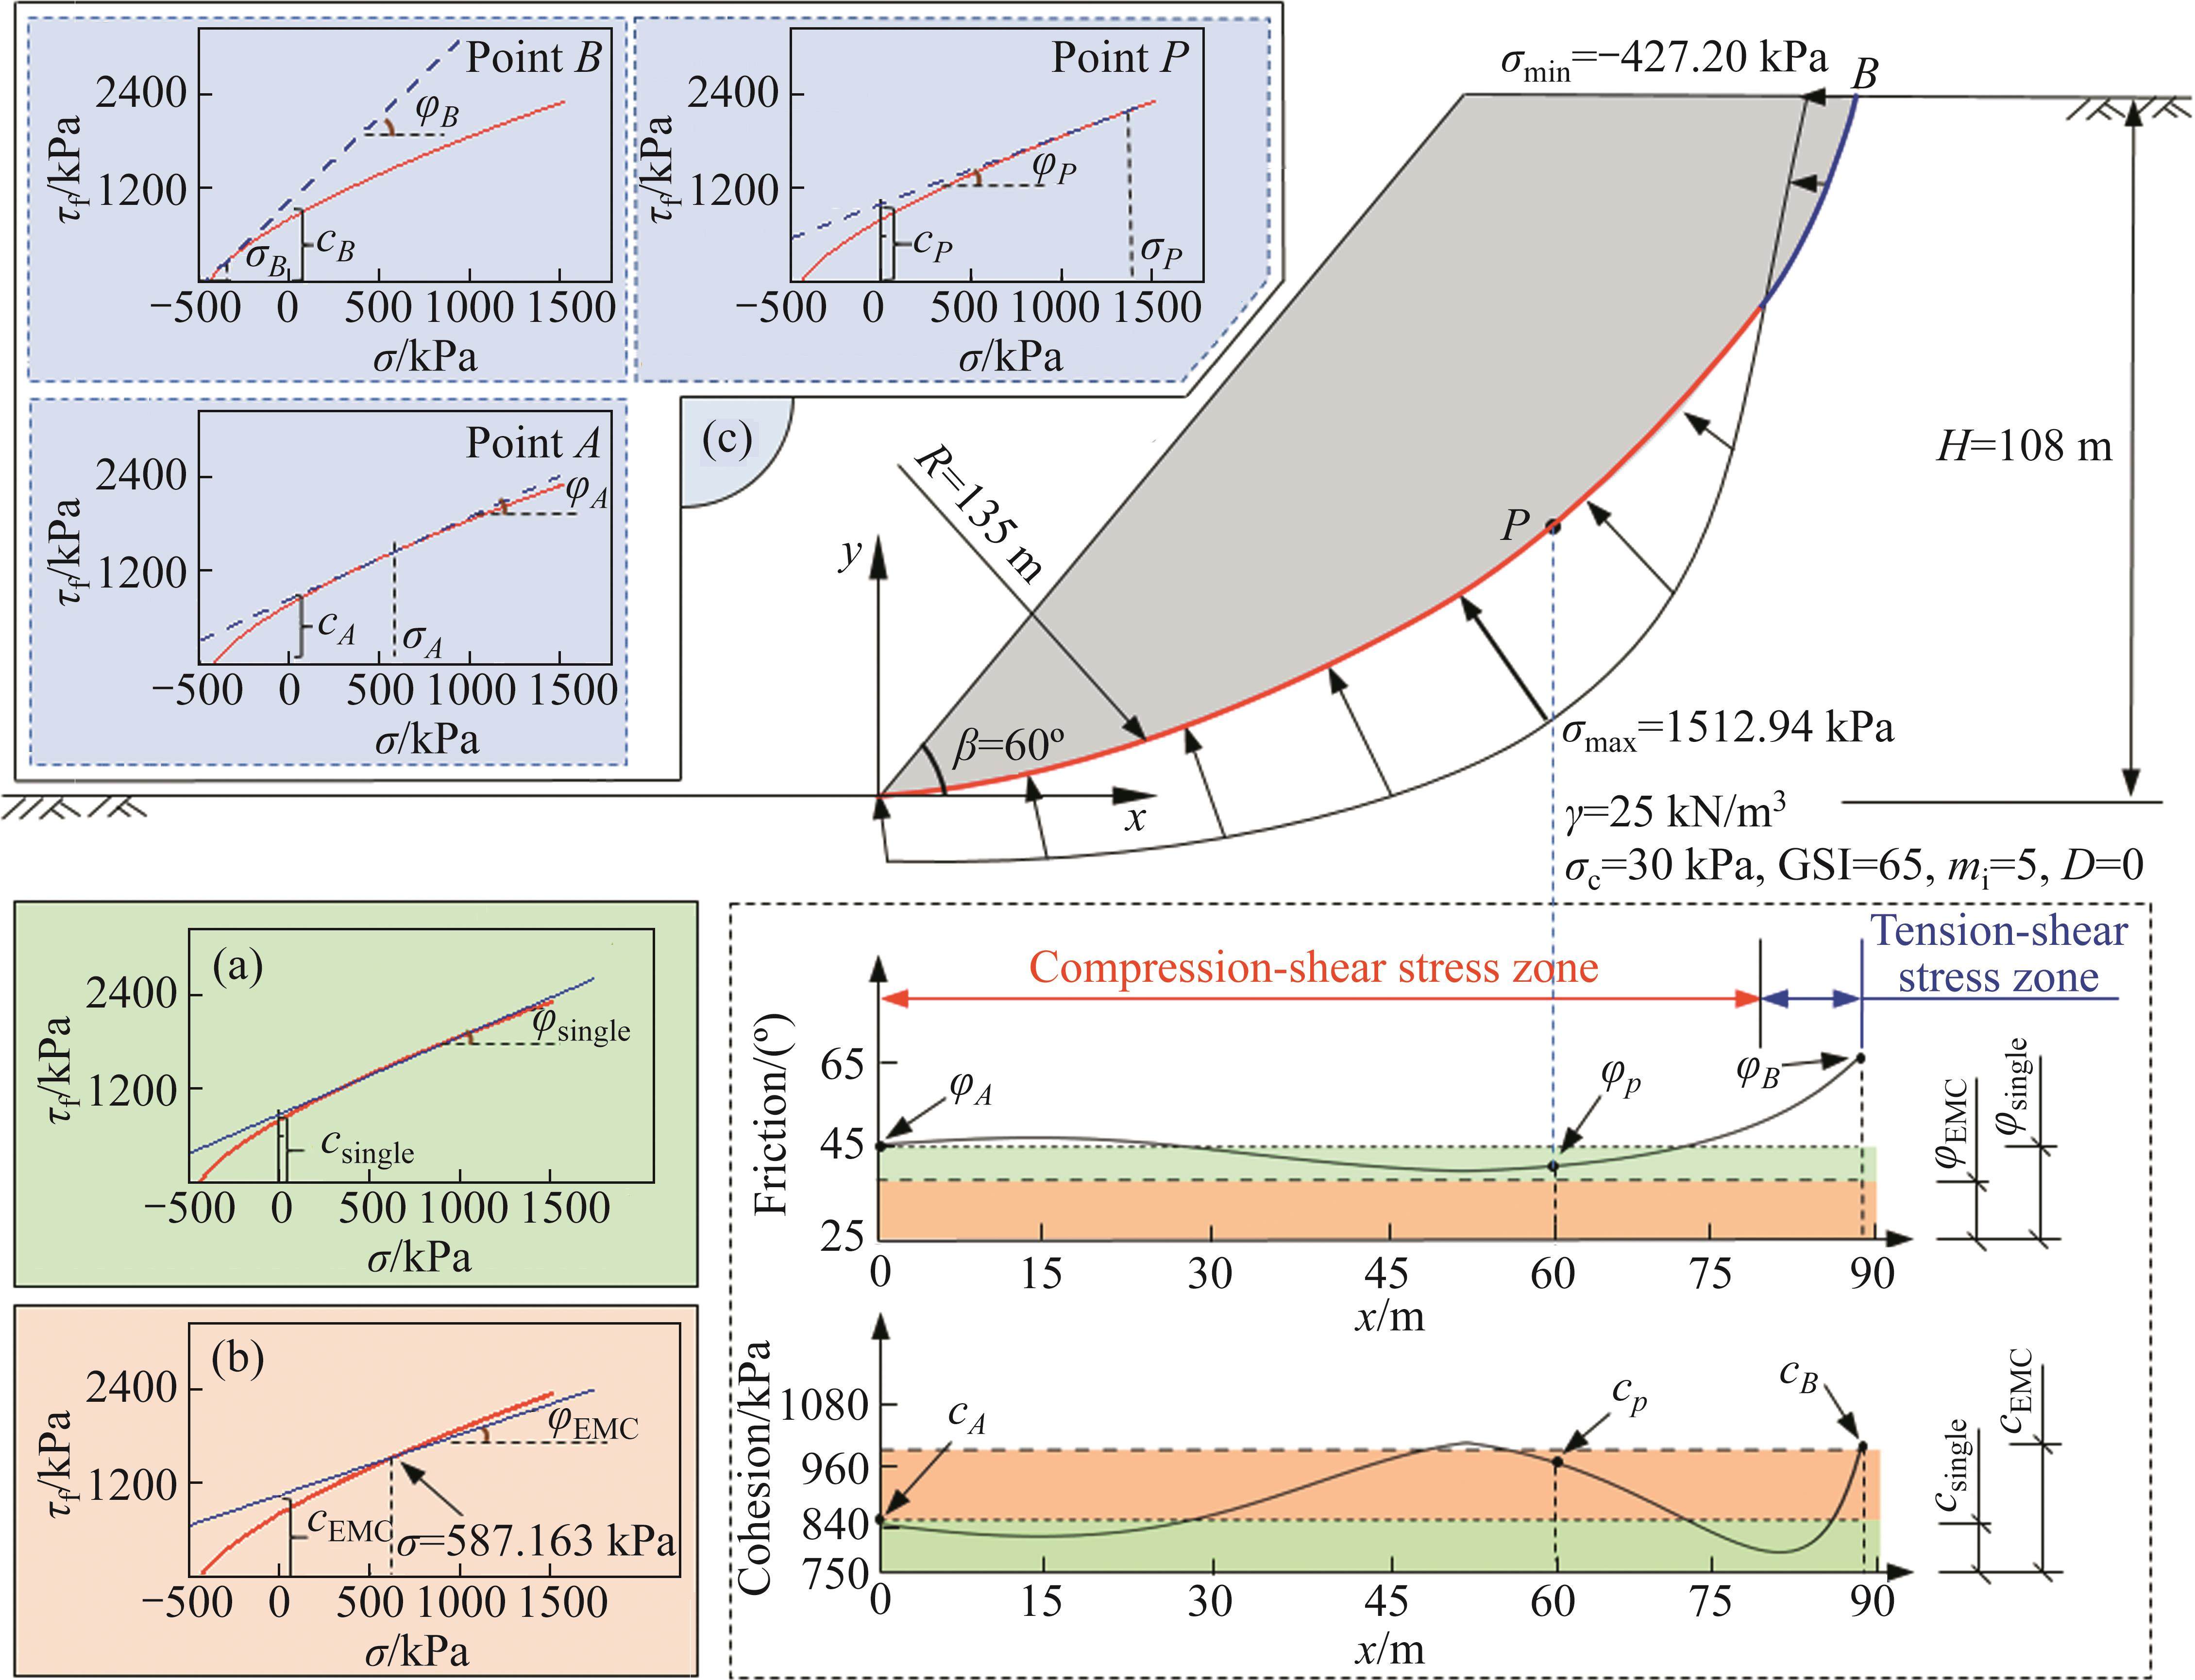
The observations from Figure 4 are as follows:
1) Except for the tension-shear stress zone, the instantaneous internal friction angle and cohesion of the rock mass on the SS exhibit opposite trends. An increase in the instantaneous internal friction angle leads to a decrease in the instantaneous cohesion of the rock mass. This finding aligns with the research conclusion of FU et al [34] and the characteristics of the nonlinear GHB strength envelope. It also validates the subroutine used for calculating the instantaneous strength parameters of rock mass on the SS.
2) The single-point tangent method estimates the strength parameters of rock mass on the SS using a single-point tangent on the nonlinear GHB strength envelope. It fails to capture the local influence of stress on these parameters. For instance, when the NS on the SS is tension-stress, the single-point tangent method tends to overestimate the shear strength of the rock mass on the SS.
3) The EMC strength parameter method provides constant values for the cohesive and internal friction angle of the rock mass. Compared to the instantaneous values obtained from the nonlinear GHB strength criterion, the cohesive value is numerically larger and the internal friction angle is numerically smaller, as confirmed by CHEN [33].
4) In this example, for the shear strength parameters of the rock mass in the EMC strength parameter method, when the NS σ<587.163 kPa, the obtained shear strength is too large; otherwise it is too small. However, in this particular example, the NS on the front half of the SS exceeds this value, which may affect the accuracy of the slope stability calculation.
5) The present method effectively illustrates the relationship between the stress level on the SS and the instantaneous strength parameters. Furthermore, it highlights the advantages of the present method in embedding the nonlinear GHB strength criterion into the stress-based calculation mode for the SS.
3.3 Verification of effectiveness of introducing stress constraint conditions at both ends of slip surface
The variational method is commonly used in theoretical analysis of slope stability to solve the functional equation. It incorporates boundary cross-section conditions and utilizes them to determine the variables in the stress functions on the SS [35]. However, the boundary conditions required by the variational method at the ends of the SS are primarily mathematical equations that ensure the extremum of the function, with unclear physical interpretations. To address this issue, this study proposes more rigorous stress constraint conditions at both ends of the SS based on objective boundary conditions and the spatial stress relation of one point. A comparison is then made between these proposed conditions and the boundary cross-section conditions of the variational method.
In this section, five slope examples are selected from the studies conducted by BAKER [36], CHEN et al [37], and HOU et al [38] for analysis. By applying Eqs. (18) and (21), it can be observed that the stress constraint conditions at both ends of the SS, obtained through the known boundary conditions and the spatial stress relation of one point, yield σA/[τAtan(ω-αA)]=1 and -σB/(τBtanαB)=1. Based on the stability analysis results of the five slope examples, including those presented by BAKER [36], CHEN et al [37], and HOU et al [38], this study extracted the characteristics of the slope SS and the stresses at its ends. Subsequently, the values of σA/[τAtan(ω-αA)] and -σB/(τBtanαB) are calculated, as shown in Figure 5.
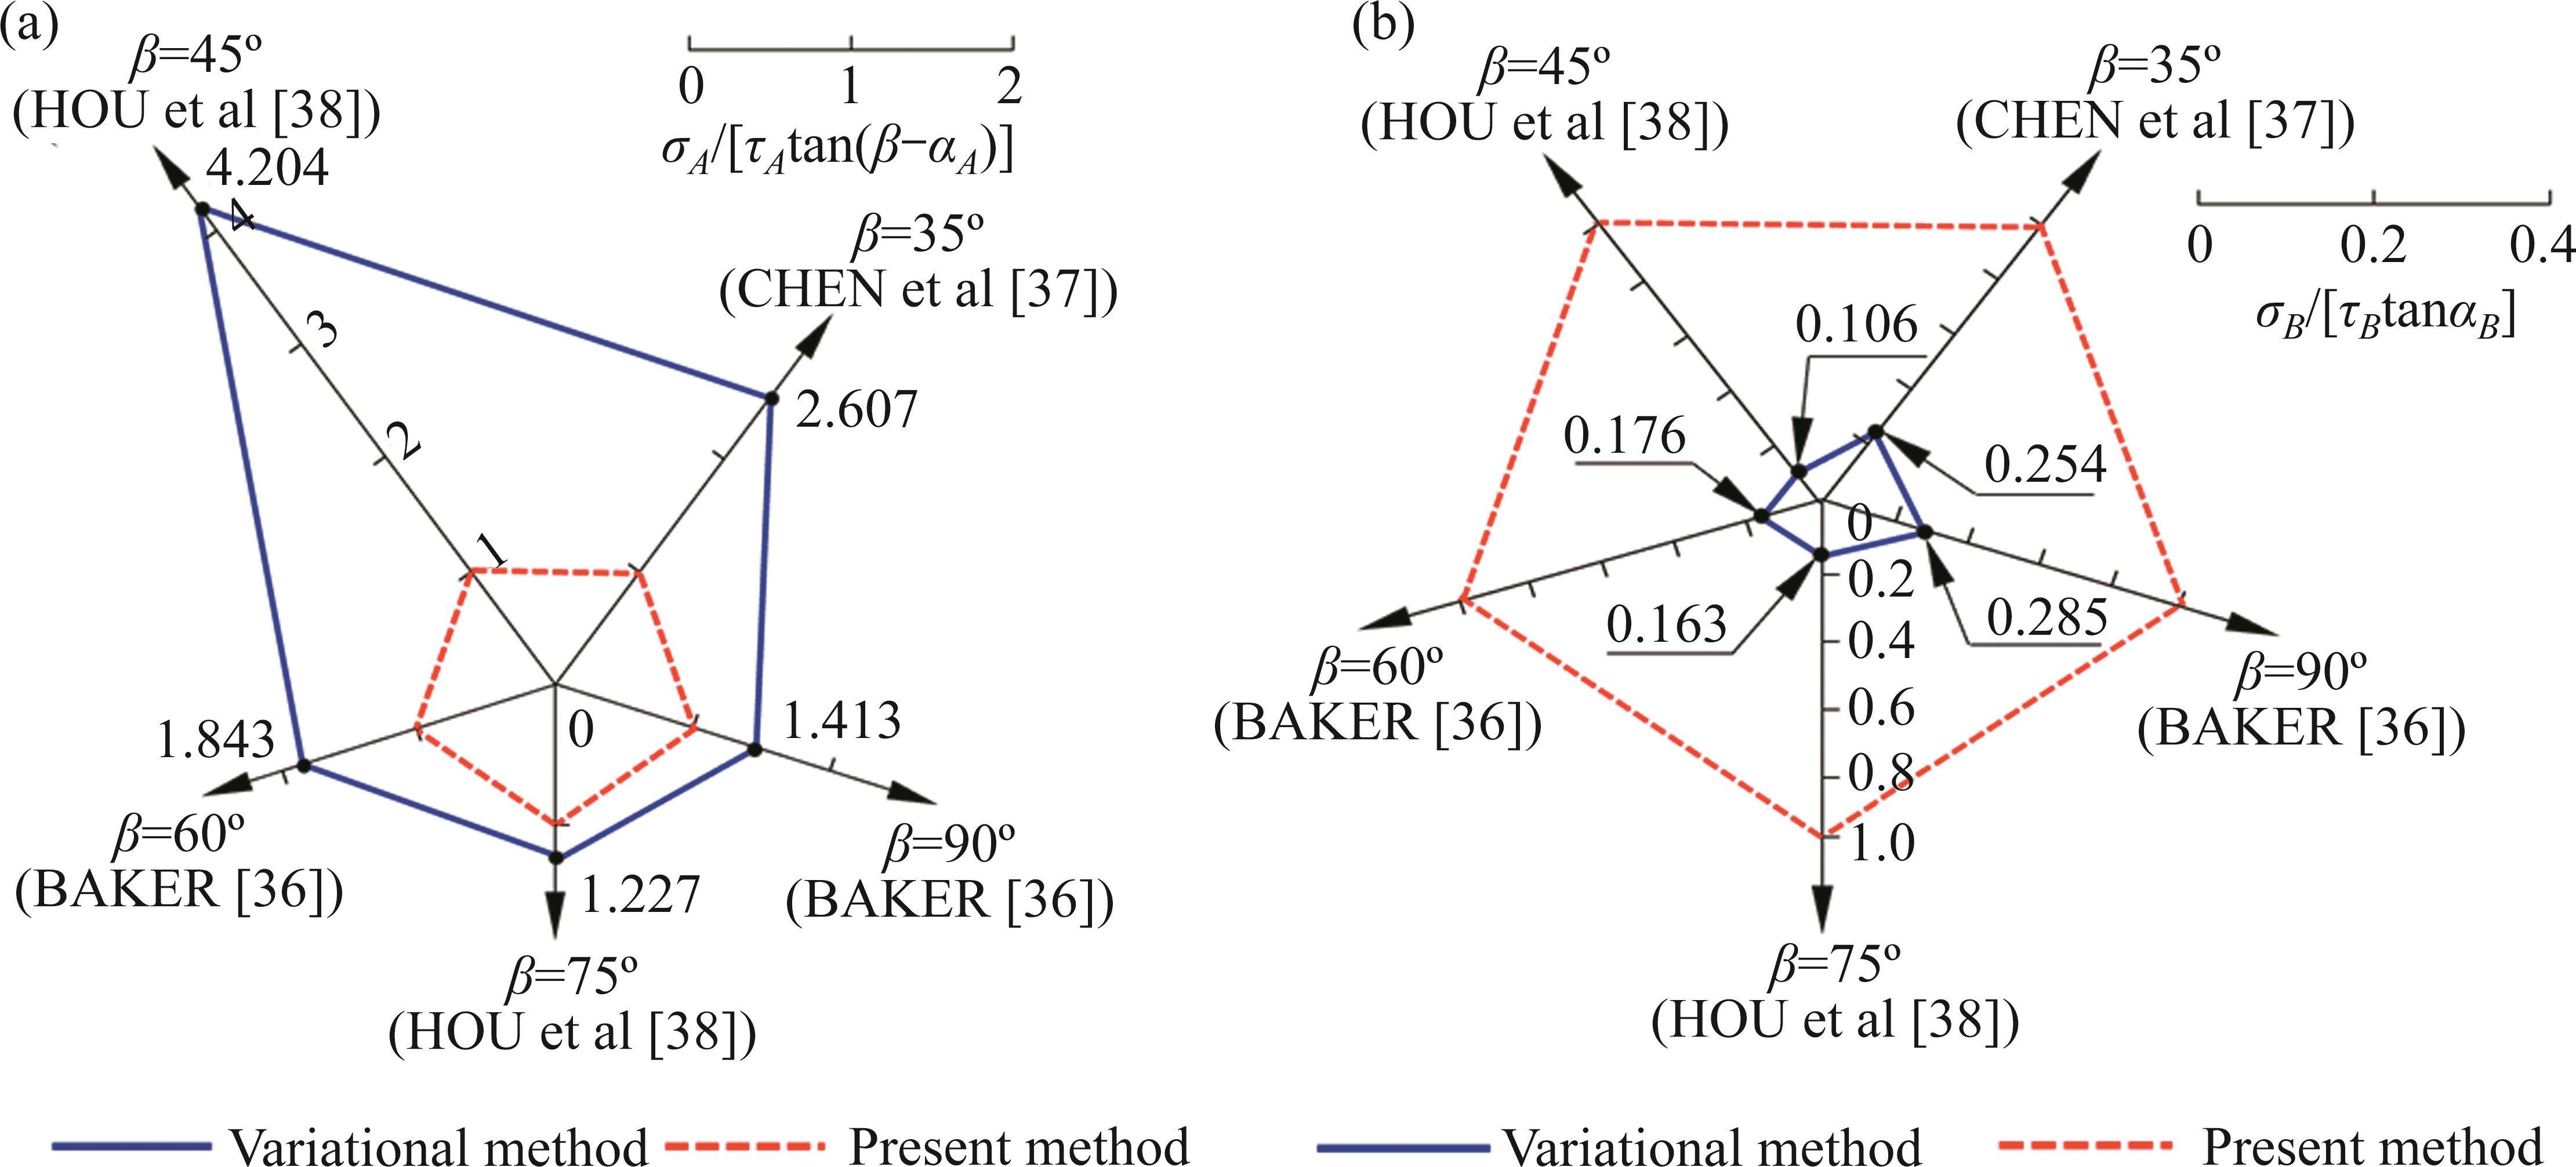
Based on Figure 5, it is evident that the boundary cross-section conditions used in the variational method fails to meet the criteria of σA/[τAtan(ω-αA)] and -σB/(τBtanαB) both being equal to 1 at the ends of the SS. Additionally, there are significant disparities between the observed values and the expected values. This indicates that the boundary cross-section conditions in the variational method do not accurately represent the stress information at the ends of the SS. In contrast, this study proposes the stress constraint conditions at the both ends of the SS that are based on the spatial stress relation of one point. These conditions have clear physical and mechanical significance. They incorporate stress information at the ends of the SS, effectively highlighting the occurrence of tension-shear near the slope top and the concentration of shear stress near the slope toe. As a result, these conditions enable a more reliable analysis of the tension- and compression-shear failure characteristics of the slope.
3.4 Verification of feasibility of identifying tension-shear stress zone near slope top
The present method analyzes the rationality of the stress functions on the SS, demonstrating that combining stress functions on the SS with the stress constraint conditions at both ends can reveal the tension-shear characteristics of the SS near the slope top. By applying the overall mechanical equilibrium conditions of the sliding body, the range of the tension-shear stress zone near the slope top can be calculated. In this section, a comparison is made between the tension-shear stress zone of the SS near the slope top obtained using the present method and the tension-shear stress zone of the slope revealed by the minimum principal stress cloud map from the numerical simulation software FLAC3D 6.0, under horizontal seismic action. This analysis validates the feasibility and accuracy of the present method in simulating the tension-shear stress zone near the slope top.
For the given slope example with a slope height (H) of 15 m and slope angle (β) of 45°, 60° and 75°, and specific rock mass parameters are provided: γ=23 kN/m3, σc=15 MPa, GSI=45, mi=12, and D=0.7. Under different slope angles and a horizontal seismic action coefficient (kH) of 0.0, 0.1 and 0.2, Table 2 presents the calculated range of the tension-shear stress zone of the SS using the present method, as compared to the minimum principal stress cloud diagram obtained from FLAC3D 6.0.
| kH | β=45° | β=65° | β=75° |
|---|---|---|---|
| 0.0 | |||
| 0.1 | |||
| 0.2 |
From the results in Table 2, several observations can be made:
1) The depth of the tension-shear stress zone (referred to the part above the white dotted line) on the SS determined by the present method is similar to the depth of the tension zone (referred to the red shadow area) of the slope revealed by the minimum principal stress cloud map in FLAC3D;
2) Increasing the horizontal seismic action coefficient (kH) results in to an expanded tension-shear stress zone of the SS near the slope top. For instance, at a slope angle (β) of 45°, the depth (HT) of the tension-shear stress zone of the SS increases from 0.906 m to 1.147 m and then to 1.552 m as kH values change from 0.0 to 0.1 and 0.2, respectively, based on the present method. These findings align with the observation that the range of the slope tension zone expands with increasing horizontal seismic action coefficient, as revealed by the analysis of the minimum principal stress cloud map in the NSM. These results further support the existence of tensile cracks at a specific depth along the rear edge of the slope prior to its collapse during seismic events.
In summary, the comparison between the present method and the numerical simulation approach demonstrates that they produce similar results, indicating a high accuracy of the present method in identifying the tension-shear stress zone of the SS near the slope top. The depth of this stress zone is influenced by both the seismic force and the slope angle. The key findings of this study can be summarized as follows:
1) Increase in slope angle: When seismic force remains constant, an increase in the slope angle results in a corresponding increase in the depth of the tension-shear stress zone along the SS. This can be attributed to the fact that a higher slope angle leads to a greater tangent angle of the SS at the upper sliding point B. As a stress constraint is applied to point B, the tensile stress in that region intensifies. Consequently, the area of the tension-shear stress near the slope top expands, ultimately leading to an increase in the height of the tension-shear stress zone on the critical SS.
2) Increase in seismic force: When the slope angle remains constant, an escalation in the seismic force causes the depth of the tension-shear stress zone along the SS to rise. The horizontal seismic force affects the slope, enhancing the discernible trend of the sliding body from the sliding bed. This, in turn, results in an increase in tensile stress within the tensile zone and a decrease in compressive stress within the compressive zone. As a result, the height of the tension-shear stress zone on the critical SS increases.
3.5 Verification of feasibility of simulating the concentration effect on the slip surface near the slope toe
Similarly, the analysis of stress functions on the SS described above demonstrates that when combined with stress constraint conditions at both ends of the SS, the stress functions effectively capture the concentration effect of compression-shear stress on the SS near the slope toe. To further investigate the applicability of the present method in the simulation of the concentration effect, the lower sliding point A of the SS is placed on the slope toe. The shear stress (τA) on the SS at point A is analyzed as the angle (β-αA) between the SS and the slope surface varies. These results are then compared with those obtained using numerical simulations. To ensure consistent shear stress direction and minimize differences caused by curvature variations along the SS, an approximate straight line SS is utilized. For this purpose, the radius (R) of the circular SS is set to a large value, such as R=10000 m.
In this specific example, the shape parameters of the homogeneous rock slope are as follows: slope height H=15 m and slope angle β=45°. The rock mass parameters are: γ=25 kN/m3, σc=5 MPa, GSI=60, mi=18, and D=0.7. The present method is employed to plot the shear stress (τA) on the SS at point A as the upper sliding point B of the approximate straight SS movers towards the slope vertex, with the horizontal distance (lB) decreasing from 150 m to 0 m. The curve of τA, with respect to the angle (β-αA) between the SS and the slope surface, is displayed in Figure 6. Additionally, a numerical model consistent with the theoretical slope is established using the numerical software FLAC3D, utilizing a refined mesh for accurate analysis. The stress components (σx, σy and τxy) of the elements at the slope toe are extracted, and the shear stress on corresponding approximate linear SS at point A is calculated. These results are also depicted in Figure 6.
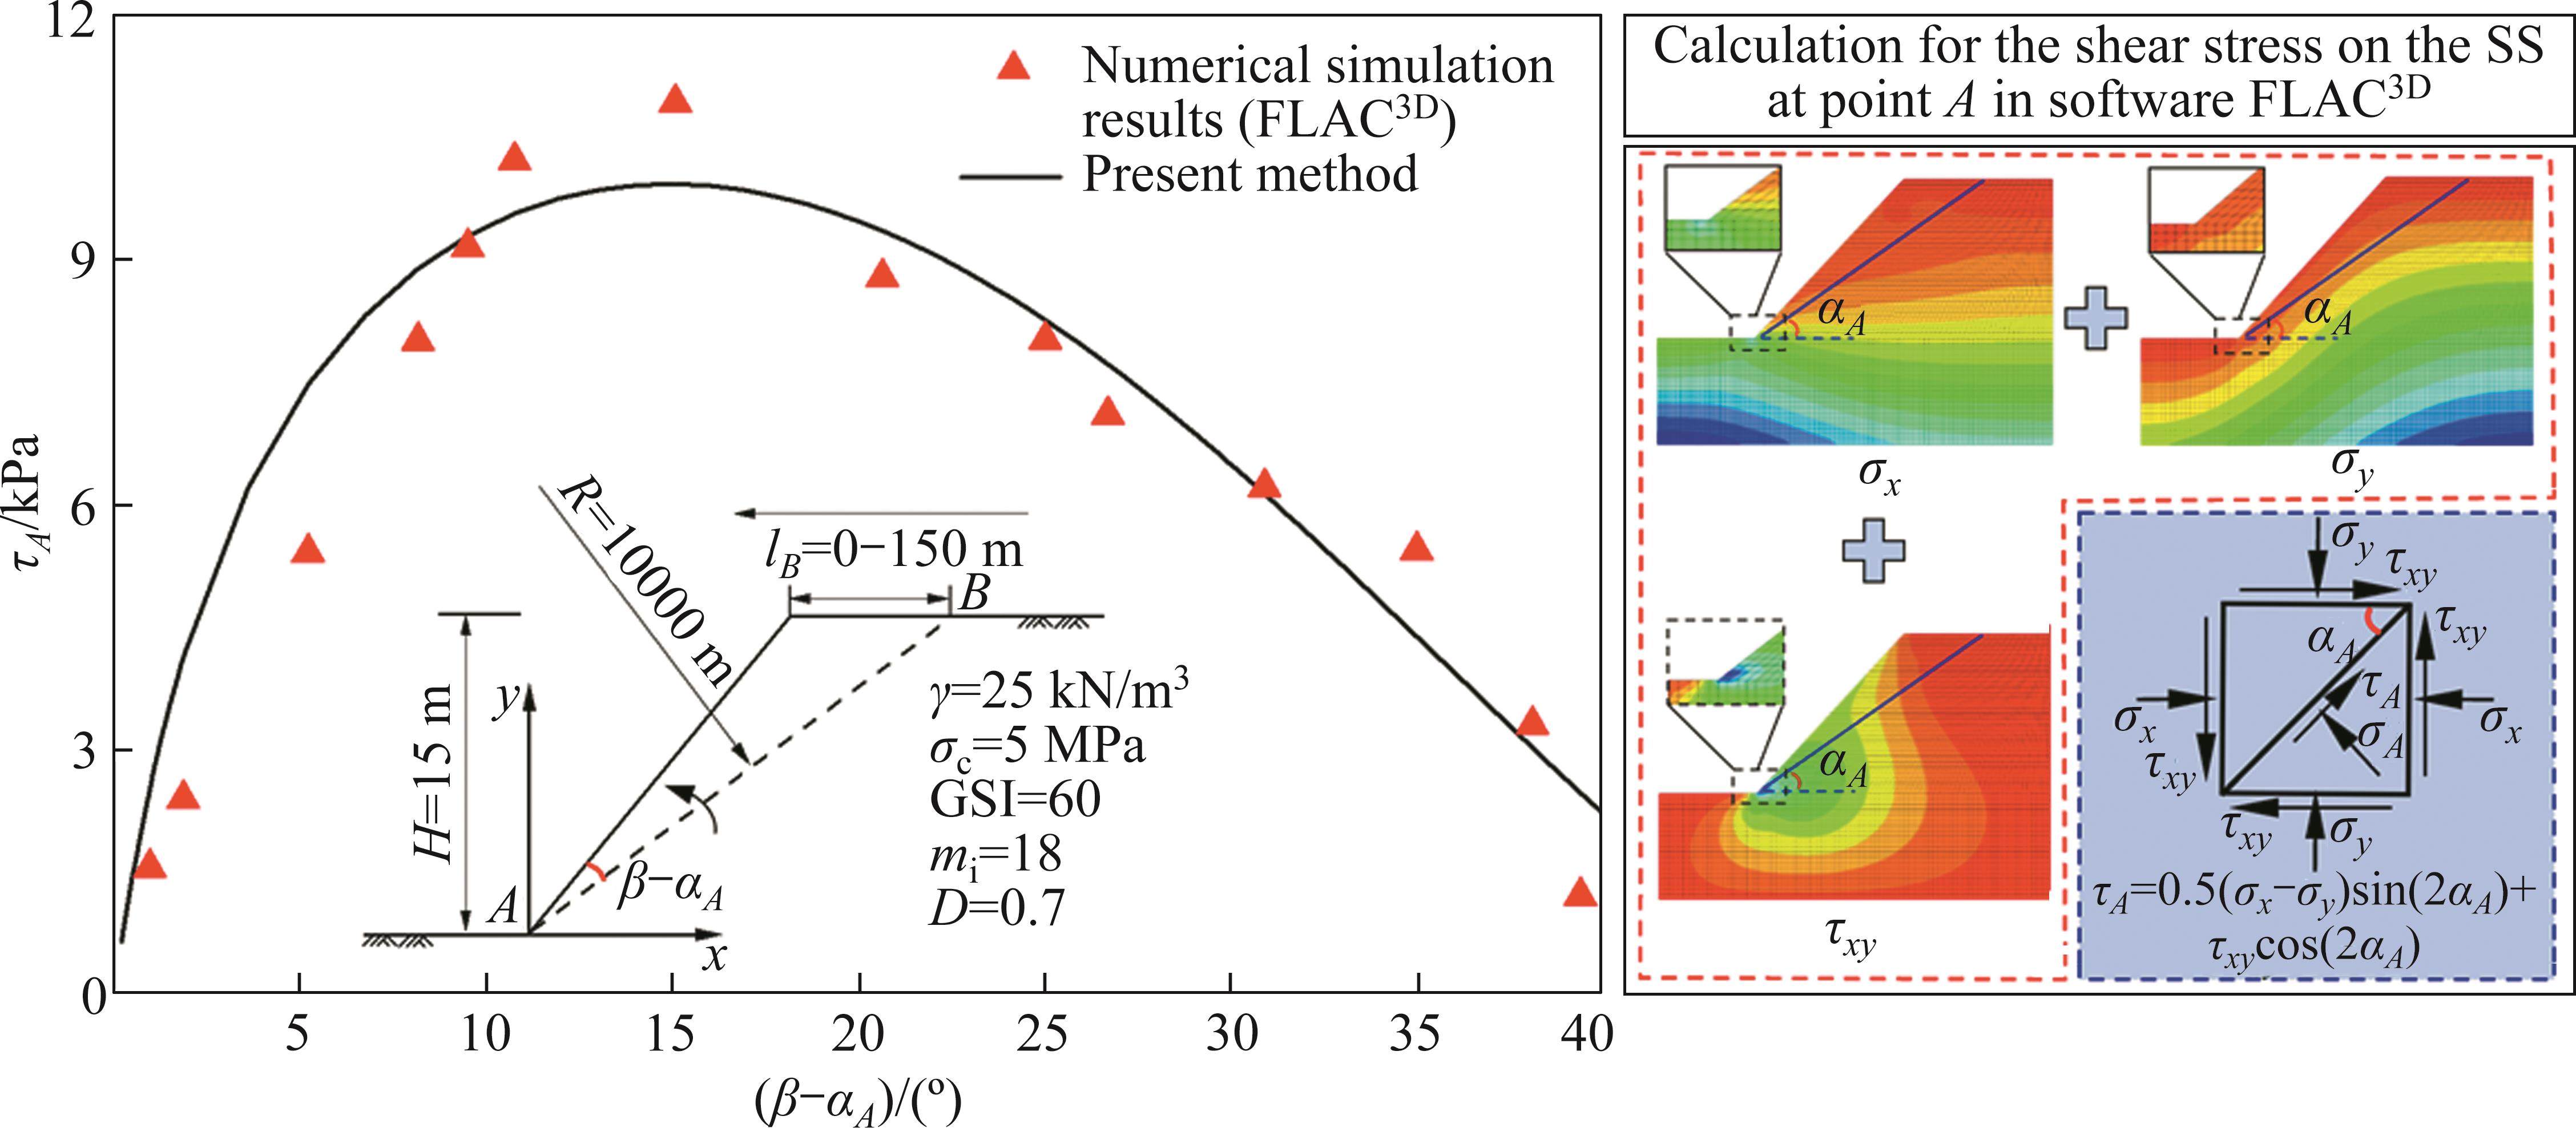
From Figure 6, several observations can be made:
1) As the upper sliding point B approaches the slope vertex, the shear stress at the lower sliding point A, obtained through the present method, initially increases and then decreases. This trend is in complete agreement with the results obtained from numerical simulations. Moreover, the values obtained from both methods closely match each other.
2) When the angle (β-αA) is greater than 15°, the shear stress at the lower sliding point A increases as the angle (β-αA) decreases. This increase can be attributed to the wedge effect formed by the approximately straight line SS and the slope surface near the slope toe. As the tip angle of the wedge becomes smaller, the wedge effect intensifies, resulting in a concentration of compression-shear stress.
3) Conversely, when the angle (β-αA) is less than 15°, the shear stress at the lower sliding point A decreases as the angle (β-αA) decreases. This is because the point A is located on both the SS and the slope surface, with no force acting on the latter. Consequently, as the approximate straight line
SS approaches to the slope surface (i.e., the angle (β-αA) approaches 0°), the shear stress on the SS at point A tends to approach zero as well.
Based on the above analysis, the effectiveness of the present method to simulate the concentration effect of compression-shear stress on the SS near the slope toe is confirmed. The present method not only yields results that closely align with numerical simulations but also accurately reflects the actual situations.
3.6 Verification of convergence for LE analysis on rock slope stability under stress-based calculation mode for the slip surface
The present approach employs an iterative loop strategy to conduct LE analysis on slope stability. This approach allows for the utilization of optimization techniques or enumeration methods to determine minimum slope FOS while exploring the slope critical SS. It is essential to note that an excessive number of iterations or divergence during the iterative calculation process can significantly reduce computational efficiency and hinder the accuracy of the results. Therefore, evaluating computational convergence is crucial to assess the feasibility of the present method.
To probe the computational efficiency and convergence of the present method, a homogeneous rock slope is selected with a circular SS. The shape parameters of this rock slope include a slope height (H) of 20 m and a slope angle (β) of 45°. The circular SS parameters consist of xA =0 m, xB ranging from 10 m to 40 m in 0.5 m increments, and R varying from 30 m to 50 m in 0.5 m steps. Here, xA and xB denote the x-axes coordinate of the lower (A) and upper (B) sliding points, respectively, while R represents the radius of the circular SS. Utilizing these parameters, various circular SSs are generated, and the number of iterations required to determine the slope FOS for each variation is recorded.
Figure 7 presents statistics on the distribution of the number of iteration loop calculations to determine the slope FOS using the different SSs mentioned above. Upon analyzing these outcomes, the following observations are made:
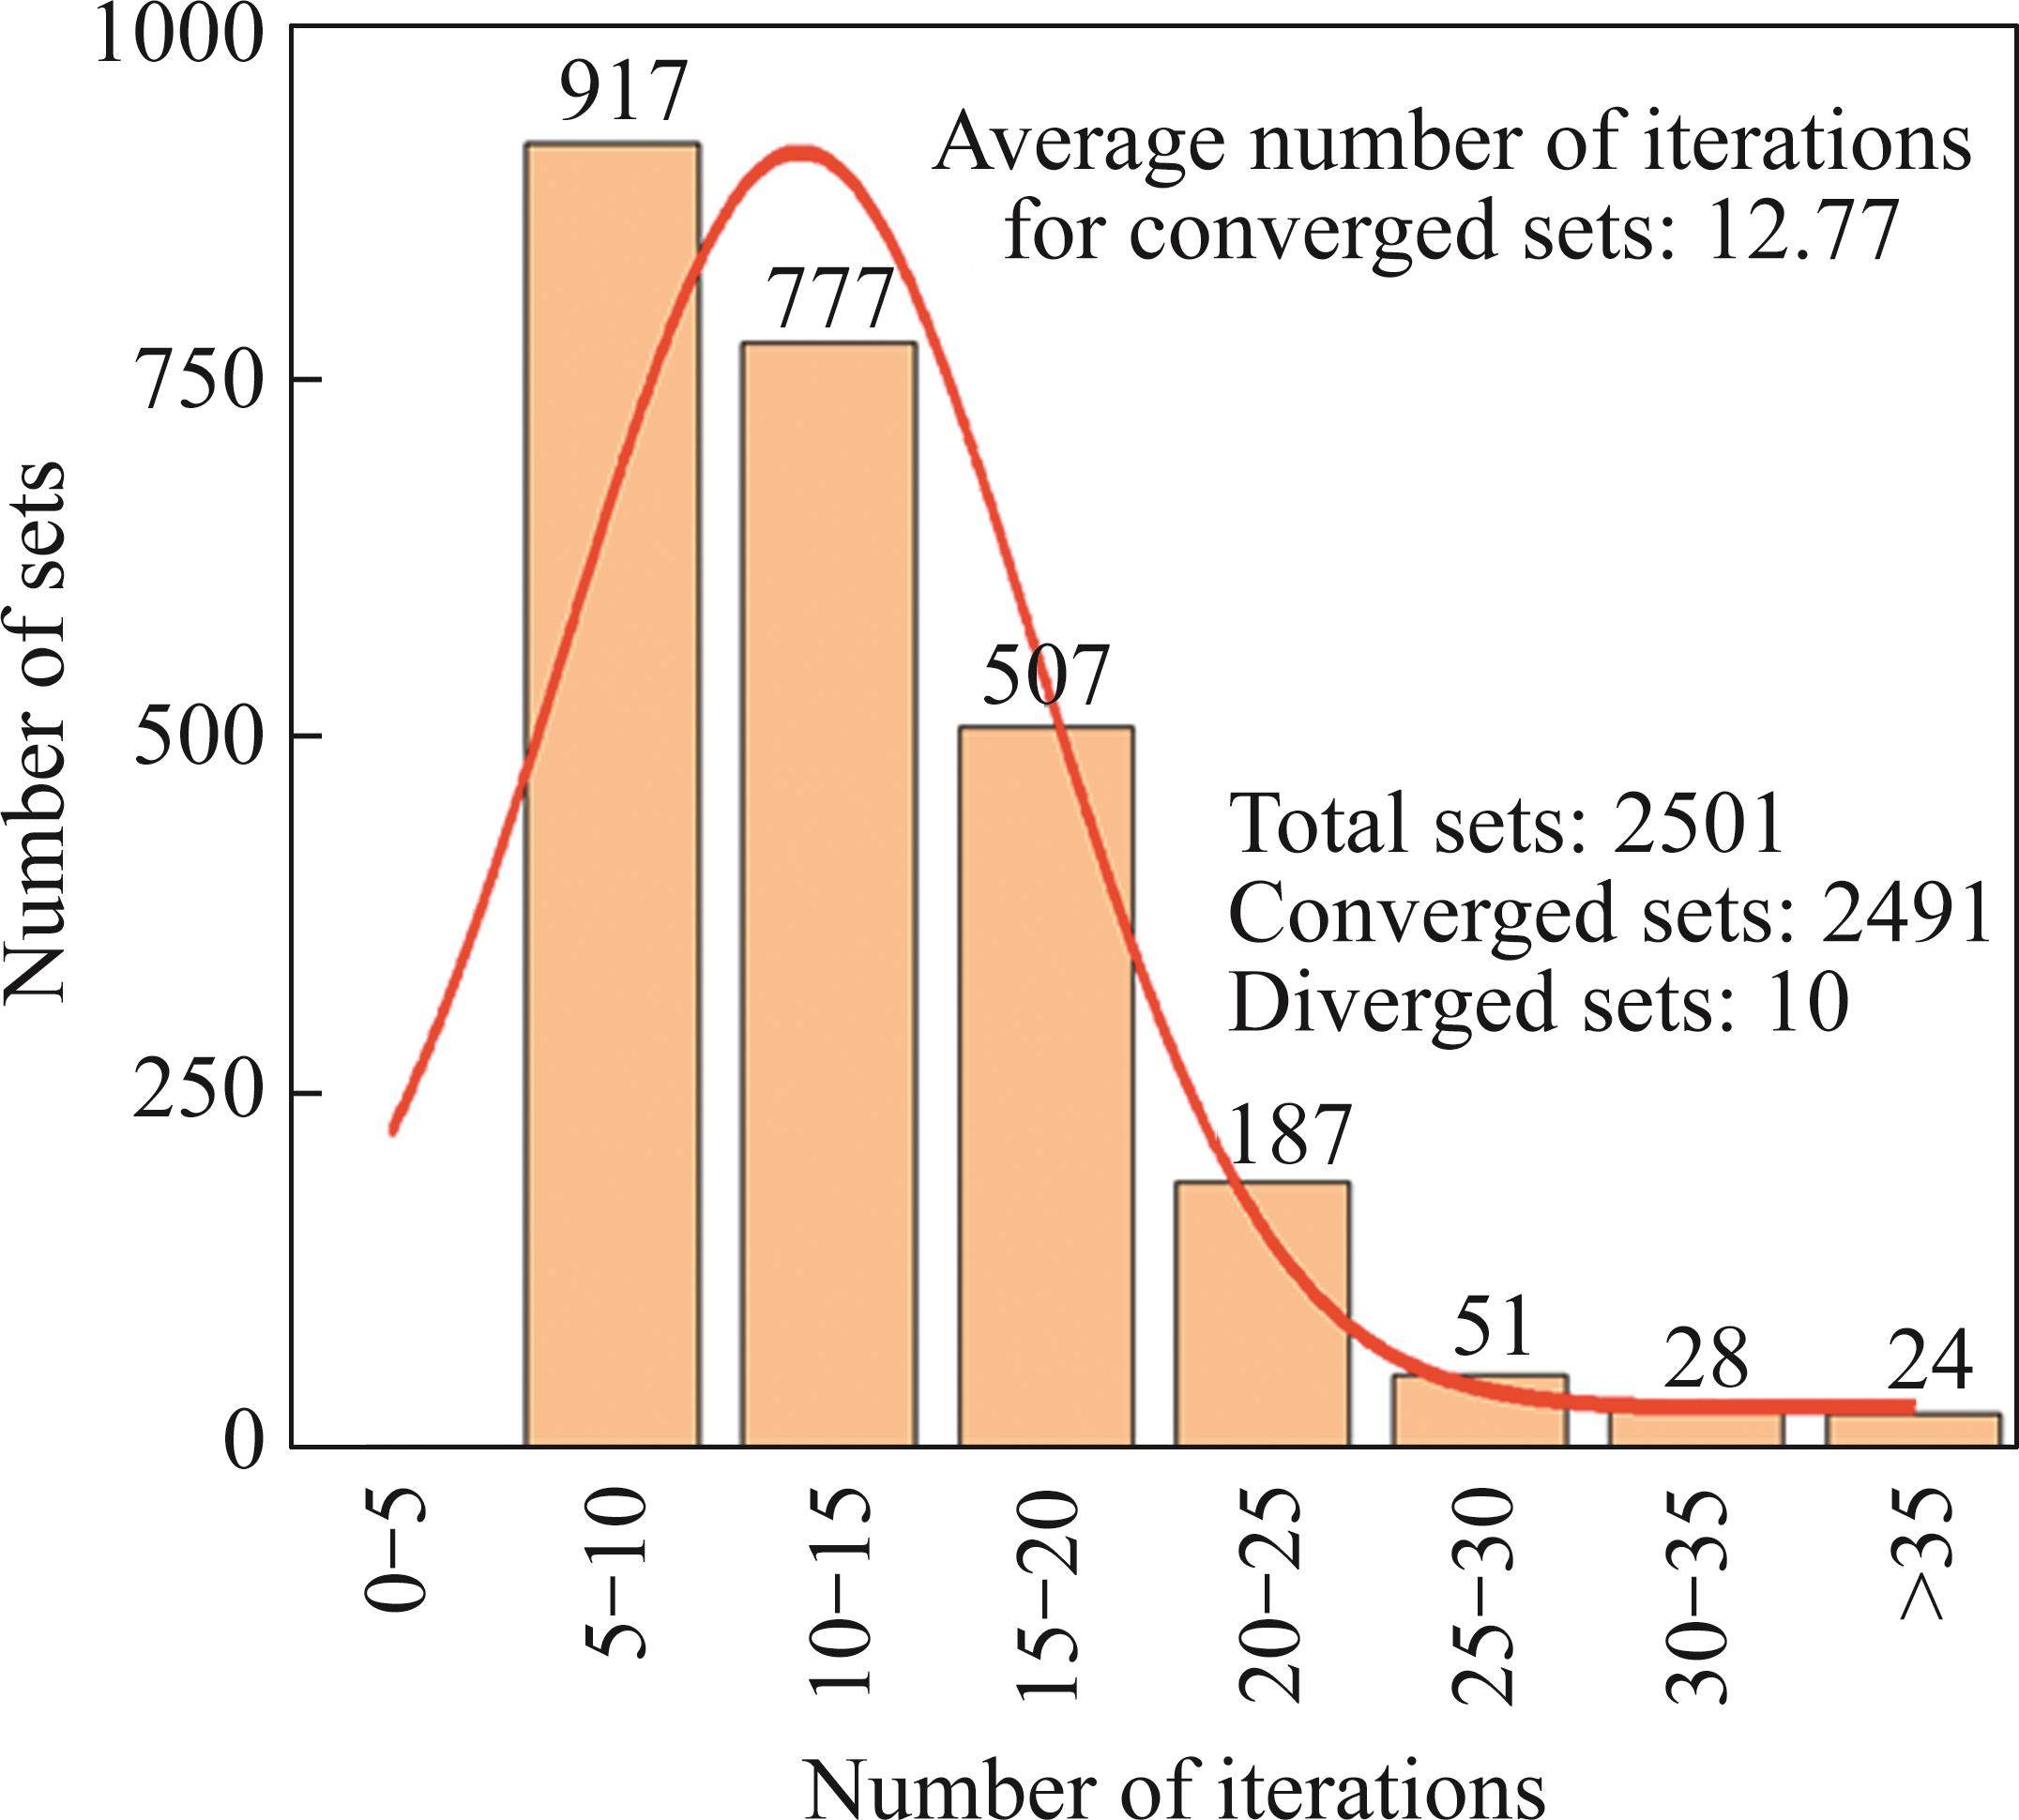
1) Out of the specified combination of circular SS parameters, a total of 2501 sets of SSs are created. The calculation converged on 2491 sets of SSs and diverged on only 10 sets of SSs, resulting in a computational convergence rate of 99.6% using the present method.
2) The average number of iterations required to determine the slope FOS is 12.77 for the 2491 sets of SSs. Additionally, the number of iterations is less than 21 for roughly 90% of the sets out of the total 2491 SSs.
Based on the analysis above, the efficiency of the present method in achieving convergence to determine the slope FOS is confirmed. Not only does the present method exhibit strong convergence, but it also demonstrates high computational efficiency.
4 Comparison and analysis on rock slope examples
To conduct a comprehensive analysis of the stability of rock slopes and evaluate the applicability and feasibility of the present method, both homogeneous and heterogeneous rock slope examples are selected. These examples will be utilized to compare and assess the effectiveness of the present method in comparison to other existing methods. A detailed comparative overview of these examples is given in Table 3.
| Example | Slope types | Calculation condition | Comparative method | Comparative item |
|---|---|---|---|---|
| 1 | Simple homogeneous slope | Variations in D | LEM | Minimum slope FOS |
| 2 | Simple homogeneous slope | Variations in β, GSI, and mi | LAM | Minimum slope FOS |
| 3 | Homogeneous slope with a horizontal step | No | Various methods (including LEM, LAM, NSM, etc.) | Minimum slope FOS and critical SS position |
| 4 | Three-layer inclined layered slope | Variations in kH and kV | NSM (FLAC2D) | Minimum slope FOS and critical SS position |
| 5 | Three-layer inclined layered slope with a horizontal step | Variations in kH and kV | NSM (FLAC3D) | Minimum slope FOS and critical SS position |
| 6 | Three-layer anti-inclined layered slope with a weak interlayer | Variations in kH and kV | NSM (FLAC3D) | Minimum slope FOS and critical SS position |
4.1 Homogeneous rock slope examples
Slope example 1: In this example, taken from DENG et al [39], a homogeneous rock slope is considered with a slope height (H) of 20 m and a slope angle (β) of 45°. The rock mass parameters are given as follows: γ=23 kN/m3, σc=184 kPa, GSI=75, mi=15, and D=0, 0.2, 0.4, 0.6, 0.8, 1.0. The slope stability is performed using the LEM combined with the linear EMC strength parameters (EMC-LEM) and the present method. The disturbance factor D is varied from 0.0 to 1.0, and the minimum slope FOS (Fs _ min) is calculated, as presented in Table 4.
| Case | H/m | β/(°) | γ/(kN∙m-3) | σc/kPa | GSI | mi | D | Minimum slope FOS (Fs_min) | Difference/% | |
|---|---|---|---|---|---|---|---|---|---|---|
| EMC-LEM | Present method | |||||||||
| 1 | 20 | 45 | 23 | 184 | 75 | 15 | 0.0 | 1.445 | 1.409 | 2.49 |
| 2 | 20 | 45 | 23 | 184 | 75 | 15 | 0.2 | 1.393 | 1.362 | 2.23 |
| 3 | 20 | 45 | 23 | 184 | 75 | 15 | 0.4 | 1.331 | 1.306 | 1.88 |
| 4 | 20 | 45 | 23 | 184 | 75 | 15 | 0.6 | 1.256 | 1.238 | 1.43 |
| 5 | 20 | 45 | 23 | 184 | 75 | 15 | 0.8 | 1.160 | 1.153 | 0.60 |
| 6 | 20 | 45 | 23 | 184 | 75 | 15 | 1.0 | 1.038 | 1.041 | -0.29 |
Slope example 2: This example, described by LI et al [40], involves a homogeneous rock slopes with a slope height (H) of 25 m and an unknown slope angle (β). The rock mass parameters are as follows: γ=23 kN/m3, σc, GSI, mi, and D=0.0. LI et al [40] applied the LAM combined with the single-point tangent method to determine the dimensionless parameter σc/(γH) when the minimum slope FOS was 1.000. By varying the slope angle (β) from 45° to 75°, and GSI values of 50 and 30, along with mi values of 15 and 5, respectively, LI et al [40] obtained the dimensionless parameter values, as shown in Table 5. The present method is then used to re-analyze the slope stability using these values, and the resulting minimum slope FOS is listed in Table 5.
| Case | H/m | β/(°) | γ/(kN∙m-3) | σc/kPa | GSI | mi | D | Minimum slope FOS (Fs_min) | Difference/% | |
|---|---|---|---|---|---|---|---|---|---|---|
| LAM | Present method | |||||||||
| 1 | 25 | 45 | 23 | 0.369 | 50 | 15 | 0.0 | 1.000 | 1.002 | -0.20% |
| 2 | 25 | 45 | 23 | 2.593 | 30 | 5 | 0.0 | 1.000 | 0.995 | 0.50% |
| 3 | 25 | 60 | 23 | 0.953 | 50 | 15 | 0.0 | 1.000 | 0.997 | 0.30% |
| 4 | 25 | 60 | 23 | 6.439 | 30 | 5 | 0.0 | 1.000 | 0.994 | 0.60% |
| 5 | 25 | 75 | 23 | 2.988 | 50 | 15 | 0.0 | 1.000 | 0.988 | 1.20% |
| 6 | 25 | 75 | 23 | 15.011 | 30 | 5 | 0.0 | 1.000 | 0.984 | 1.60% |
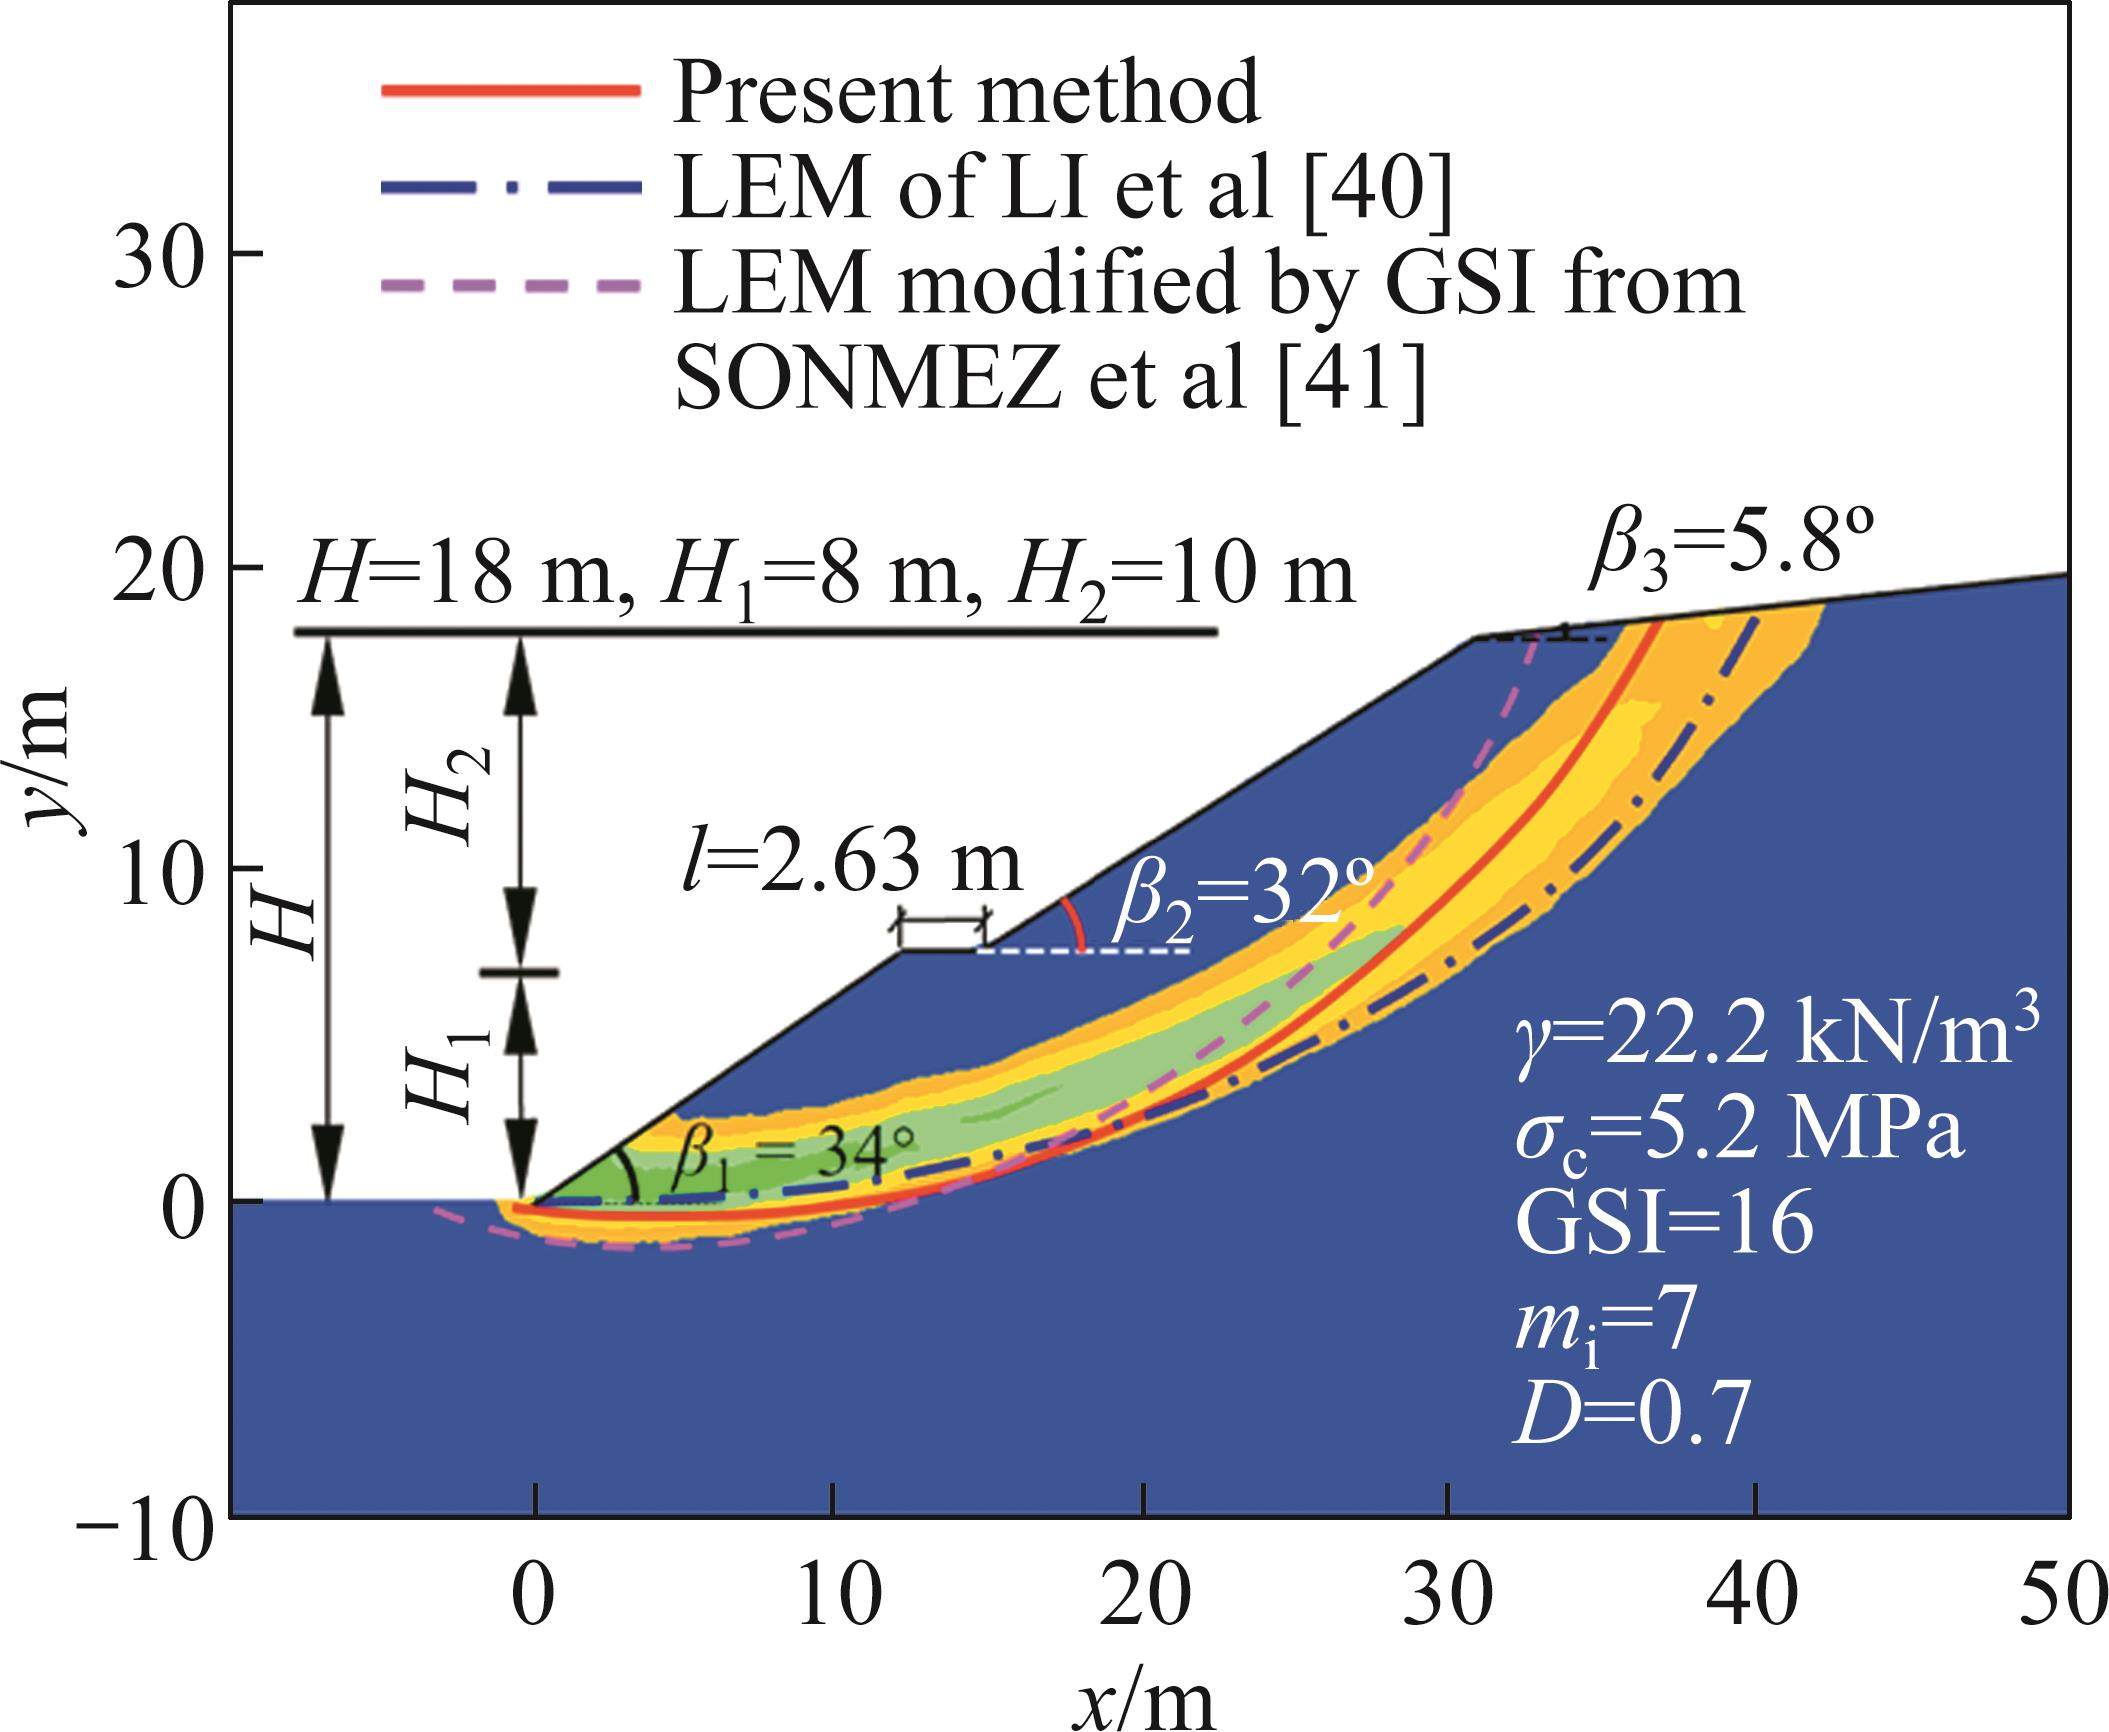
Slope example 3: In this example from SONMEZ et al [41], a homogeneous rock slope depicted in Figure 8 is considered. The slope contains a horizontal step (with a width of l=2.56 m) in its middle, dividing it into two parts. The lower slope has a slope height (H1) of 8 m and a slope angle (β1) of 34°, while the upper slope has a slope height (H2) of 12 m and a slope angle (β2) of 32°. The slope top surface has a horizontal slope angle (β3) of 5.8°. The rock mass parameters are as follows: γ=22.2 kN/m3, σc=5.2 MPa, GSI=16, mi=7, and D=0.7. Table 6 provides the results obtained from various methods and software, including the LEM of LI et al [40], LEM modified by GSI from SONMEZ et al [41], LAM of SHEN et al [42], strength reduction finite element method (SR-FEM) from SUN et al [43], software Phase2 [44], software FLAC2D 7.0 [45], and the present method. The minimum slope FOS obtained by each method is included in Table 6. Figure 8 shows the critical SSs obtained by LEM, LEM modified by GSI, and the present method, as well as the maximum shear strain rate cloud diagram reflecting the shear plastic zone of the slope obtained by the software FLAC2D 7.0.
| H/m | β/(°) | l/m | γ/ (kN·m-3) | σc/MPa | GSI | m | D | Calculation method | Minimum slope FOS (Fs_min) |
|---|---|---|---|---|---|---|---|---|---|
| H1+H2 | β1 or β2 or β3 | 2.63 | 22.2 | 5.2 | 16 | 7 | 0.7 | LEM of LI et al [40] | 0.900 |
| LEM modified by GSI from SONMEZ et al [41] | 1.000 | ||||||||
| LAM of SHEN et al [42] | 0.950 | ||||||||
| SR-FEM from SUN et al [43] | 0.930 | ||||||||
| Software Phase2 [44] | 0.960 | ||||||||
| Software FLAC2D [45] | 1.002 | ||||||||
| Present method | 0.962 | ||||||||
| Noting that: (1) H1=8 m (Lower slope) and H2=10 m (Upper slope); and (2) β1=34° (Lower slope), β2=32° (Upper slope), and β3=5.8° (Slope top). | |||||||||
From Tables 4-6, as well as Figure 8, several observations can be made:
1) In example 1, when comparing the present method with EMC-LEM, it is evident that the relative difference is less than 3%. However, the minimum slope FOS obtained using the present method is smaller. It should be noted that this particular example does not accurately showcase the significant contrast between the two methods. Nonetheless, the EMC-LEM inadequately represents the shear properties of the local rock mass on the SS due to the utilization of approximated linear strength parameters.
2) In example 2, when comparing the present method with LAM combined with the single-point tangent method, the relative difference is less than 2%. Nevertheless, the minimum slope FOS obtained using the present method is also smaller. It should be emphasized that although the LAM combined with the single-point tangent method consider the strength parameters of the rock mass as variable during the search for the critical SS, it disregards the local characteristics of the strength parameters related to the NS on the SS. Consequently, the LAM combined with the single-point tangent method does not effectively address the integration of the nonlinear GHB strength criterion into the stability analysis of rock slopes. The relatively small difference observed only indicates that there is no significant error in the overall stability analysis of the slope when employing average strength parameters of the rock mass of the SS in the given example.
3) In example 3, when comparing the present method with LEM modified by GSI, it is apparent that the critical SS obtained by the present method is closer to the shear plastic zone of the slope obtained by software FLAC2D 7.0. This can be attributed to the fact that both the present method and the software FLAC2D 7.0 directly incorporate the nonlinear GHB strength criterion, allowing the nonlinear relationship between the stresses and strength parameters on the SS to be reflected in the slope stability analysis results.
4.2 Heterogeneous rock slope examples
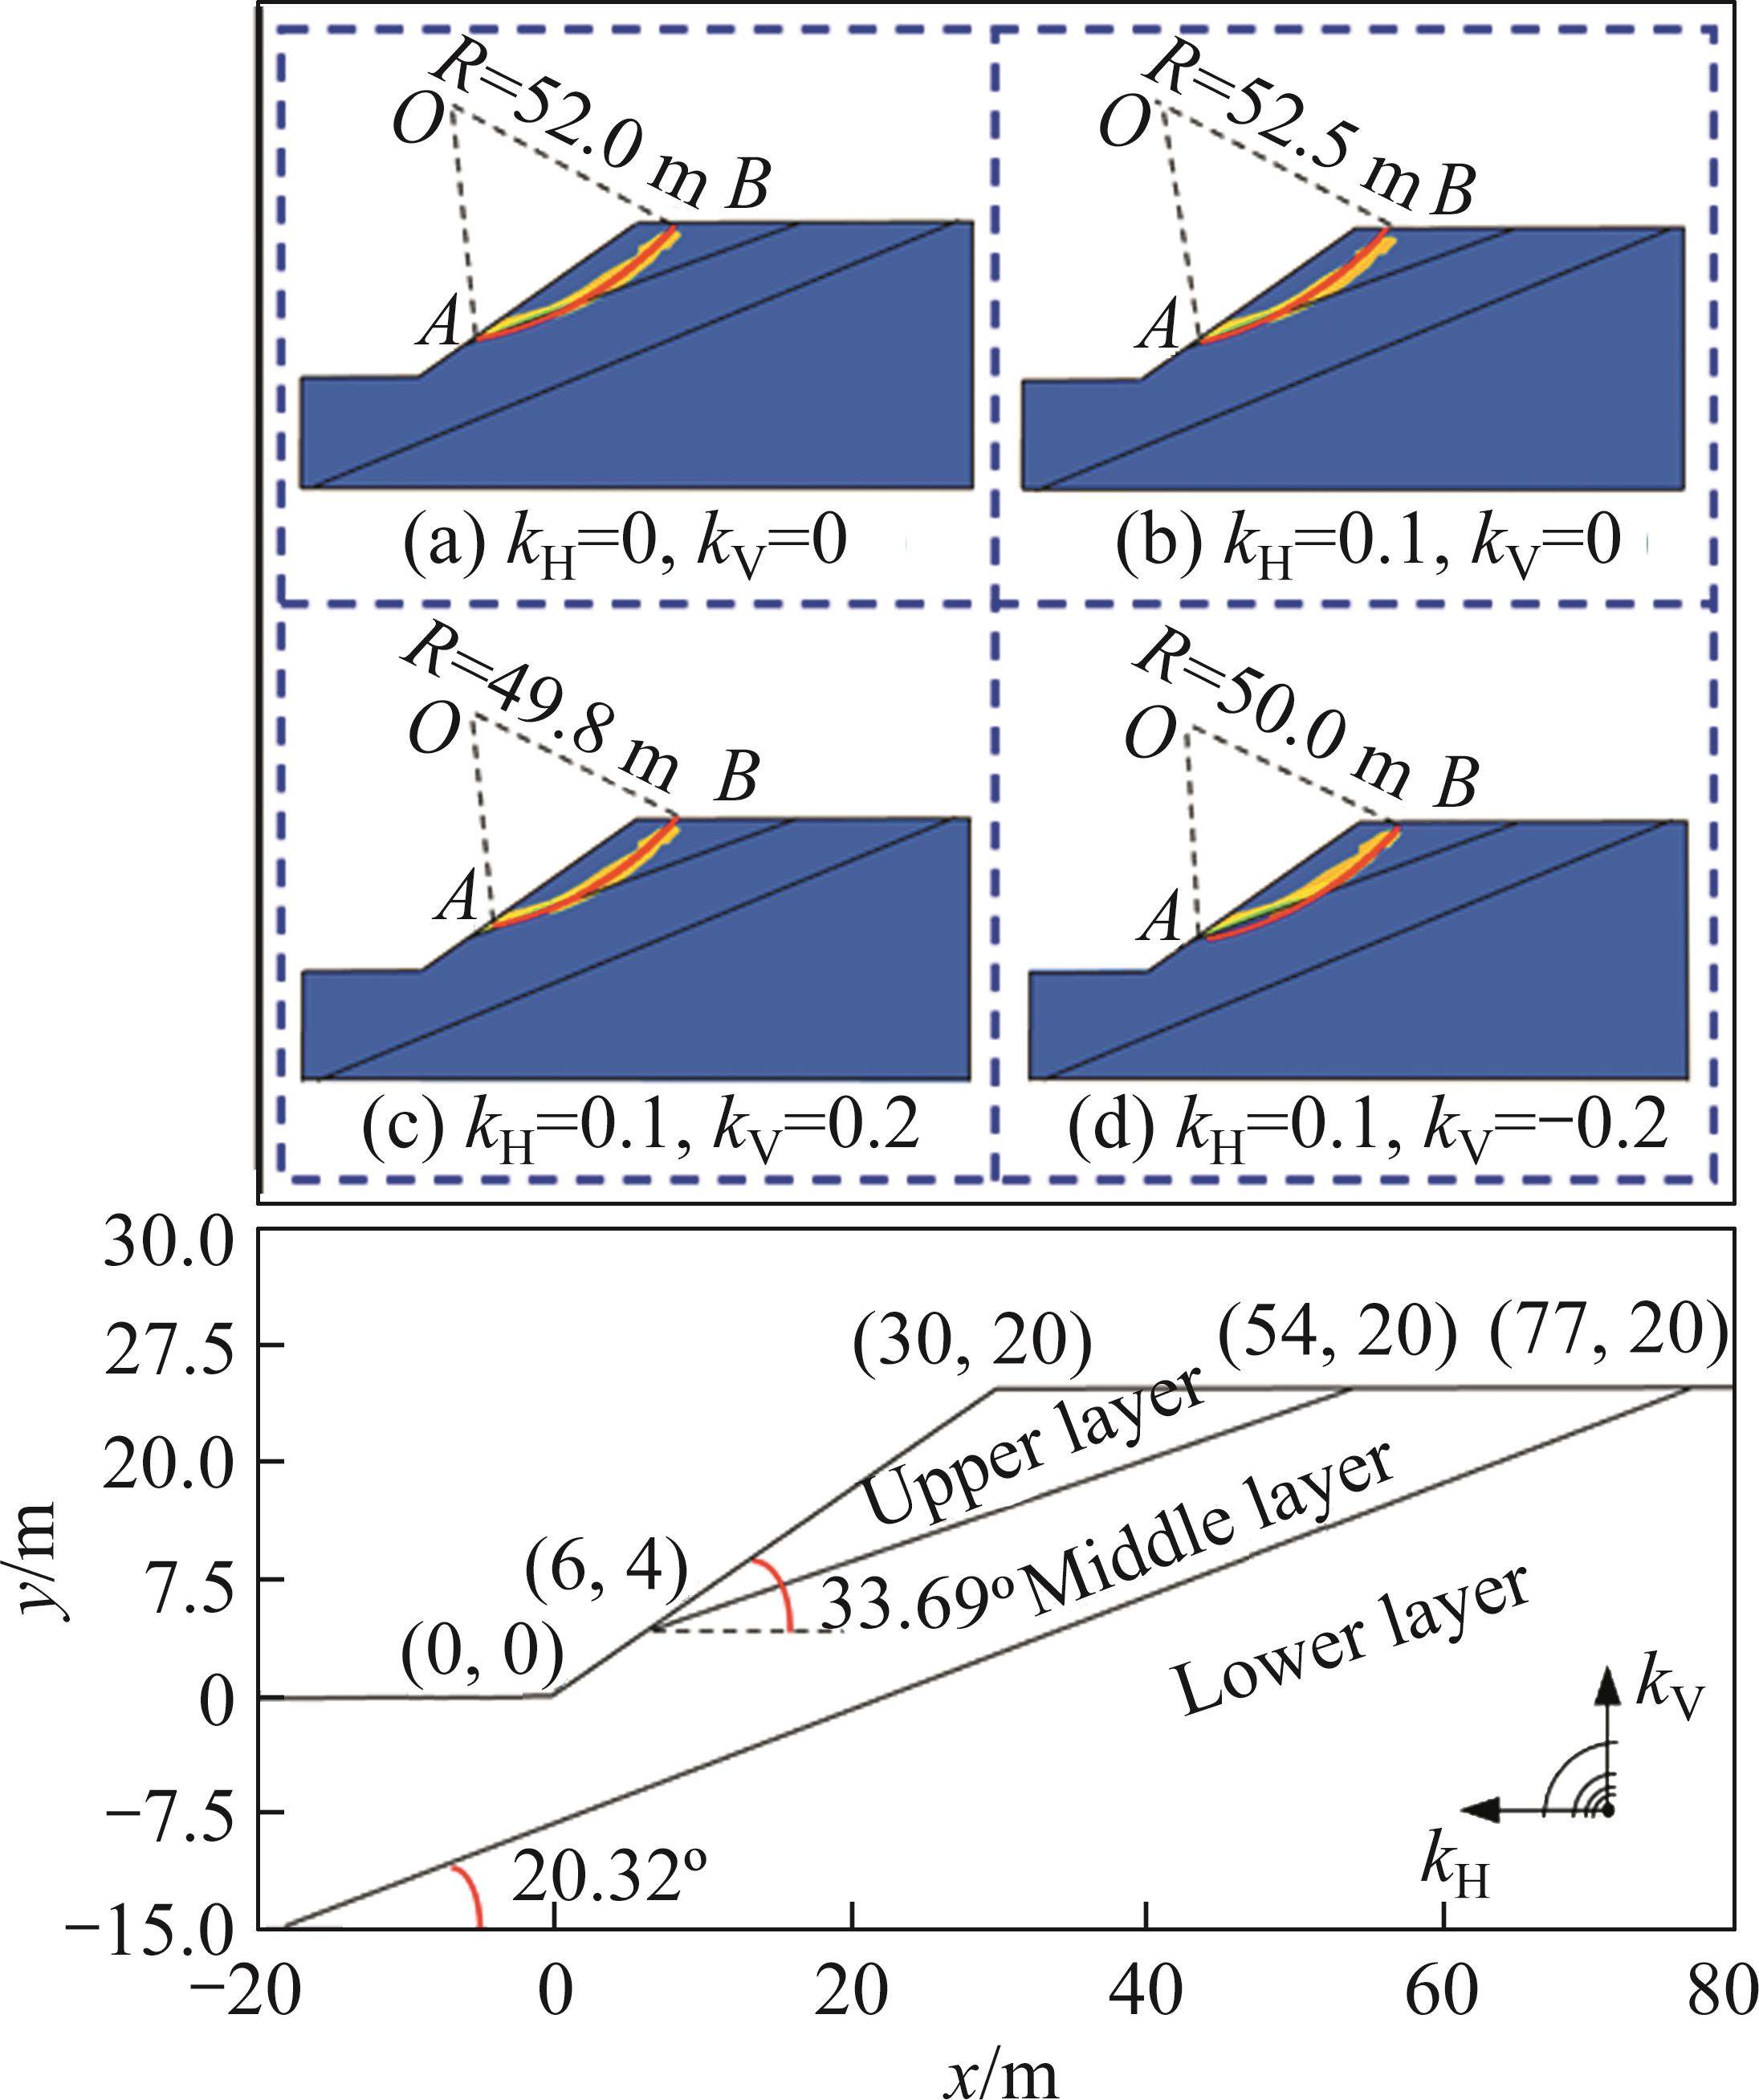
Slope example 4:Figure 9 depicts a heterogeneous rock slope example taken from AHOUR et al [44]. It showcases a three-layer inclined layered rock slope. The slope occurrence and rock mass parameters can be found in Table 7. The stability analysis of the slope is conducted using the software FLAC2D 7.0 [45], as well as the present method, considering various seismic forces. Table 7 presents the calculated minimum slope FOS. Furthermore, Figure 9 presents the critical SS obtained by the present method, accompanied by the maximum shear strain rate cloud diagram that reflects the shear plastic zone of the slope obtained through numerical simulation.
| H/m | β/(°) | kH | kV | Minimum slope FOS (Fs_min) | Difference/% | |
|---|---|---|---|---|---|---|
| FLAC2D | Present method | |||||
| 20 | 33.69 | 0.0 | 0.0 | 1.563 | 1.502 | 3.90 |
| 0.1 | 0.0 | 1.270 | 1.247 | 1.81 | ||
| 0.1 | 0.2 | 1.319 | 1.306 | 0.99 | ||
| 0.1 | -0.2 | 1.223 | 1.198 | 2.04 | ||
| Noting that: (1) γ=25 kN/m3, σc=500 kPa, GSI=60, mi=5, and D=0.4 for the upper layer; (2) γ=25 kN/m3, σc=500 kPa, GSI=80, mi=15, and D=0.2 for the middle layer; and (3) γ=25 kN/m3, σc=500 kPa, GSI=100, mi=25, and D=0.0 for the lower layer. | ||||||
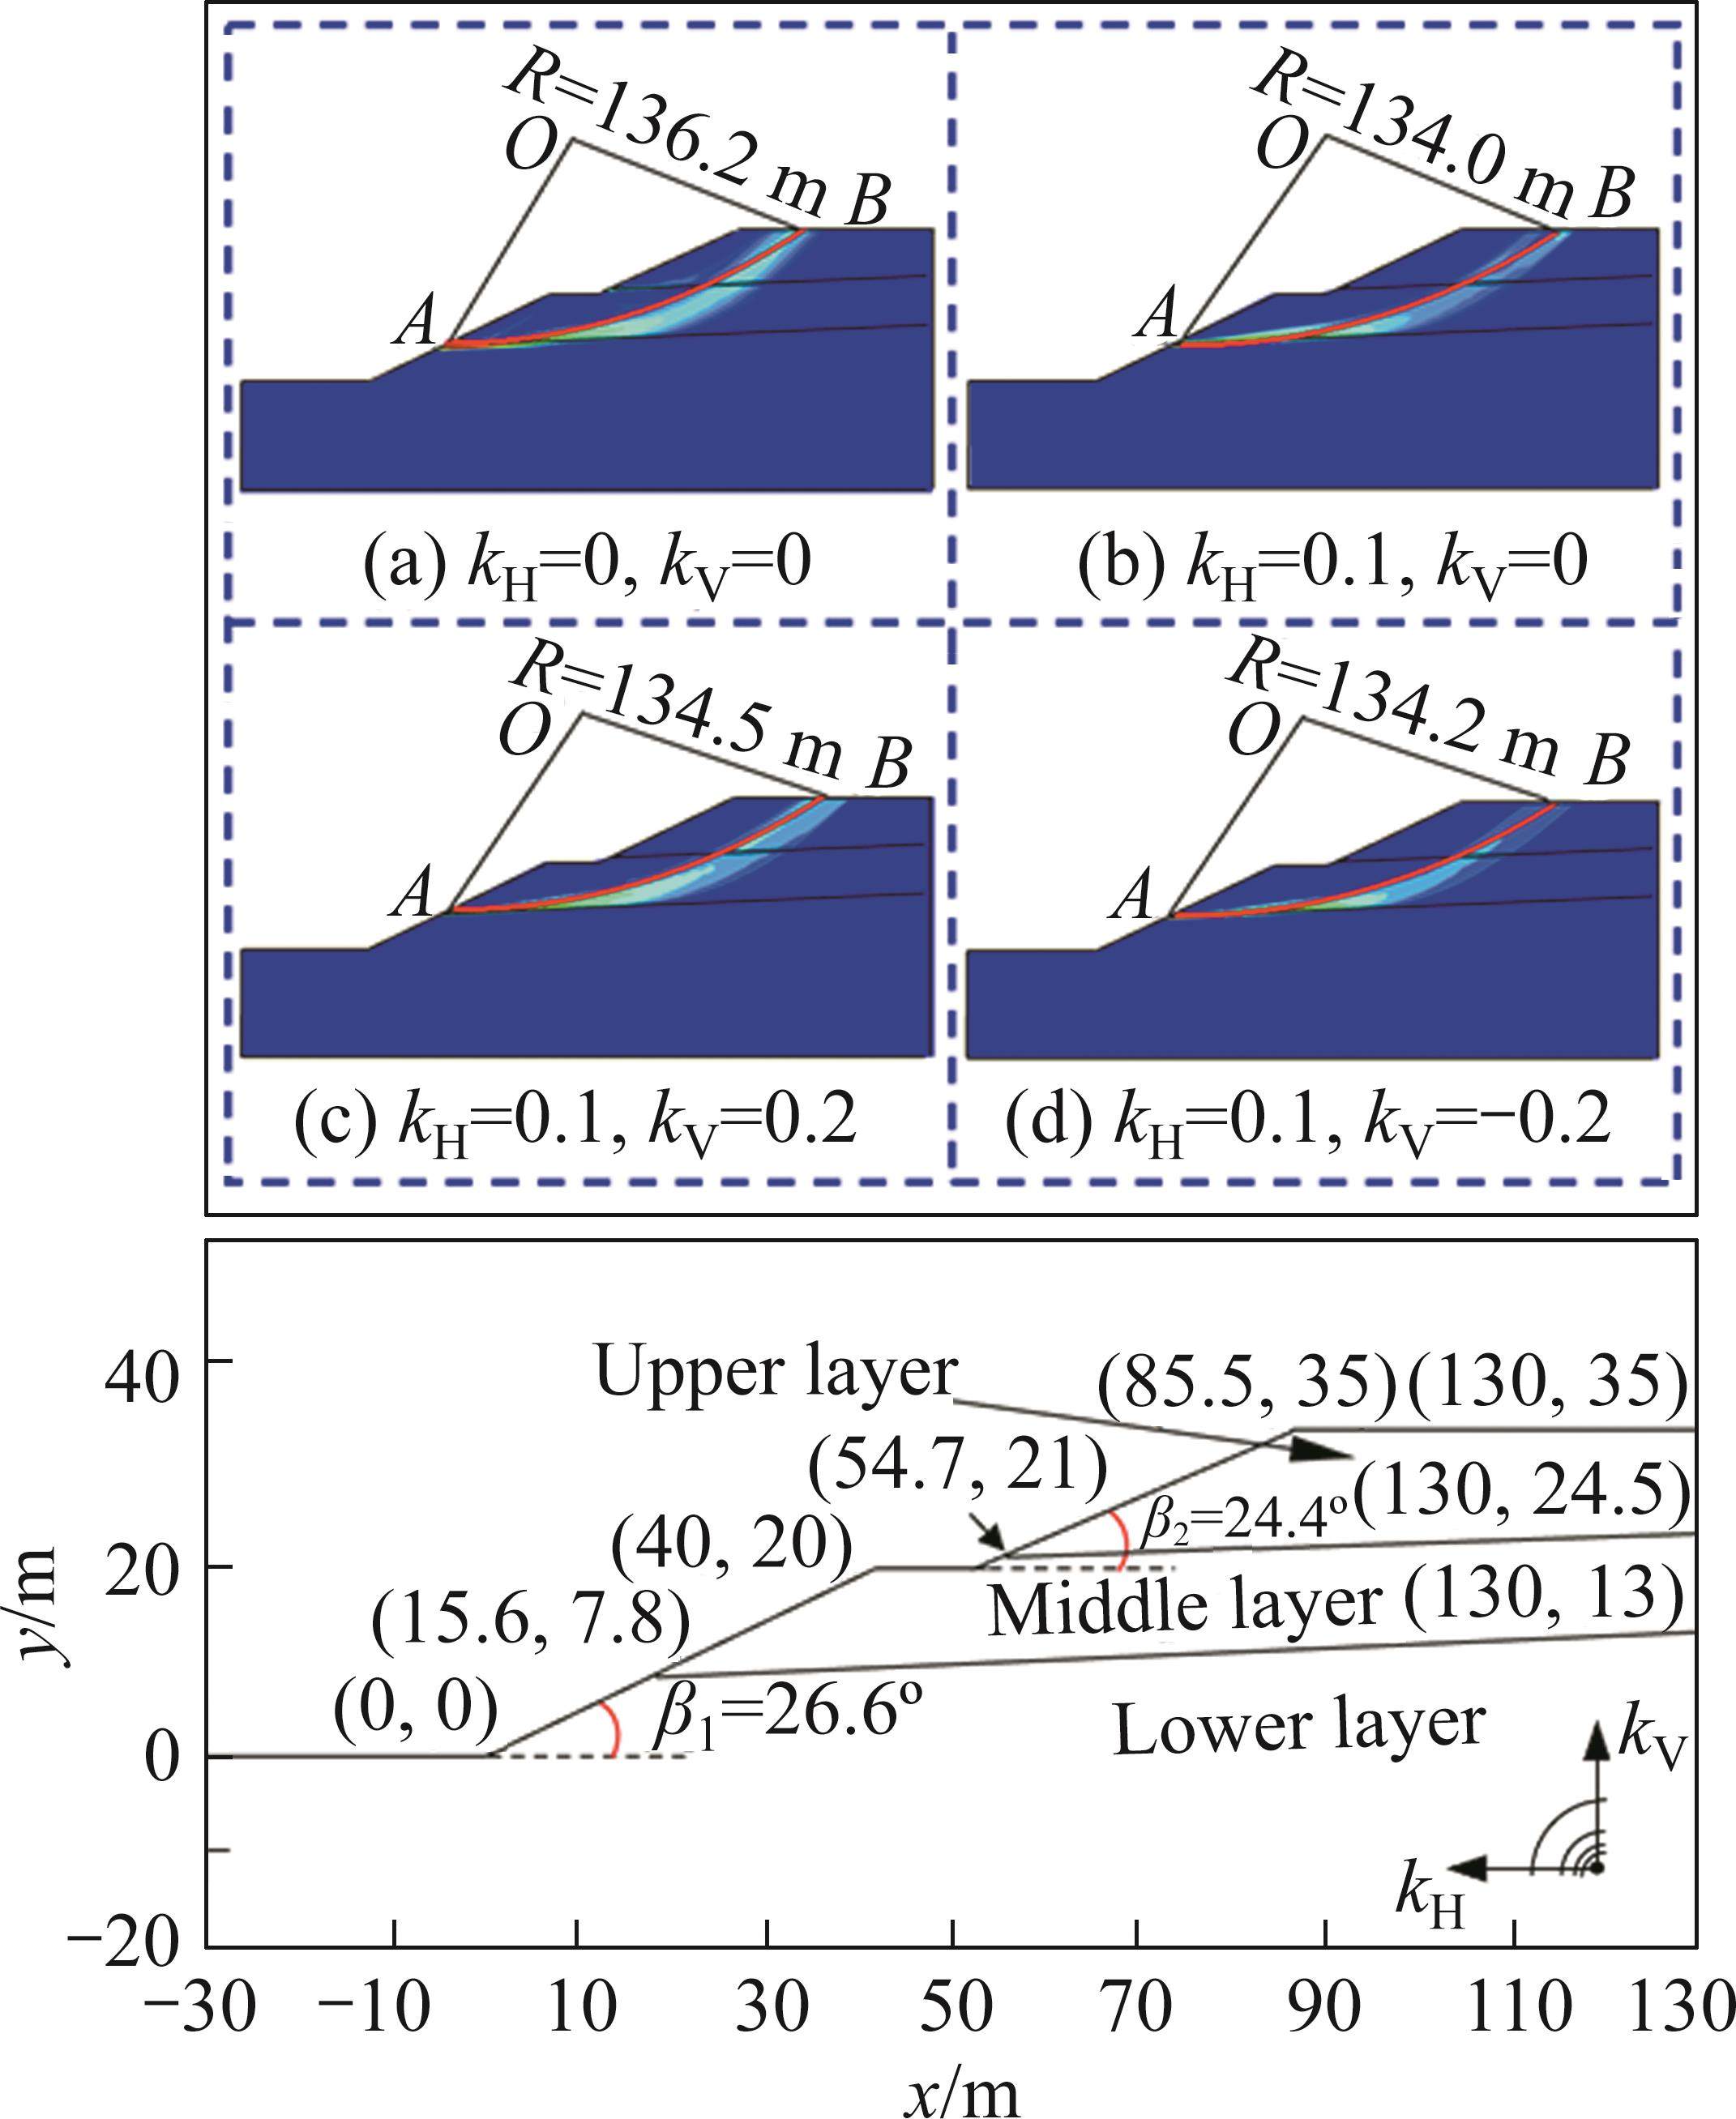
Slope example 5: In Figure 10, a heterogeneous rock slope example from LOUKIDIS et al [46] is presented. This example showcases a stepped rock slope with three layers. The slope occurrence and rock mass parameters are listed in Table 8. Similar to the previous example, the stability analysis is performed using the software FLAC3D 6.0 [32] and the present method, considering different seismic forces. Table 8 shows the calculated minimum slope FOS. Moreover, Figure 10 displays the critical SS obtained by the present method, accompanied by the maximum shear strain rate cloud diagram that reflects the shear plastic zone of the slope derived from numerical simulation.
| H/m | β/(°) | kH | kV | Minimum slope FOS (Fs_min) | Difference/% | |
|---|---|---|---|---|---|---|
| FLAC3D | Present method | |||||
| H1+H2 | β1 or β2 | 0.0 | 0.0 | 2.434 | 2.335 | 4.06 |
| 0.1 | 0.0 | 1.806 | 1.802 | 0.22 | ||
| 0.1 | 0.2 | 1.830 | 1.821 | 0.49 | ||
| 0.1 | -0.2 | 1.771 | 1.760 | 0.62 | ||
| Noting that: (1) H1=20 m (lower slope) and H2=15 m (upper slope); (2) β1=21.8° (lower slope) and β2=26.6° (upper slope); (3) γ=25 kN/m3, σc=875 kPa, GSI=50, mi=10, and D=0.5 for the upper layer; (4) γ=25 kN/m3, σc=875 kPa, GSI=50, mi=12, and D=0.5 for the middle layer; and (5) γ=25 kN/m3, σc=875 kPa, GSI=60, mi=15, and D=0.2 for the lower layer. | ||||||
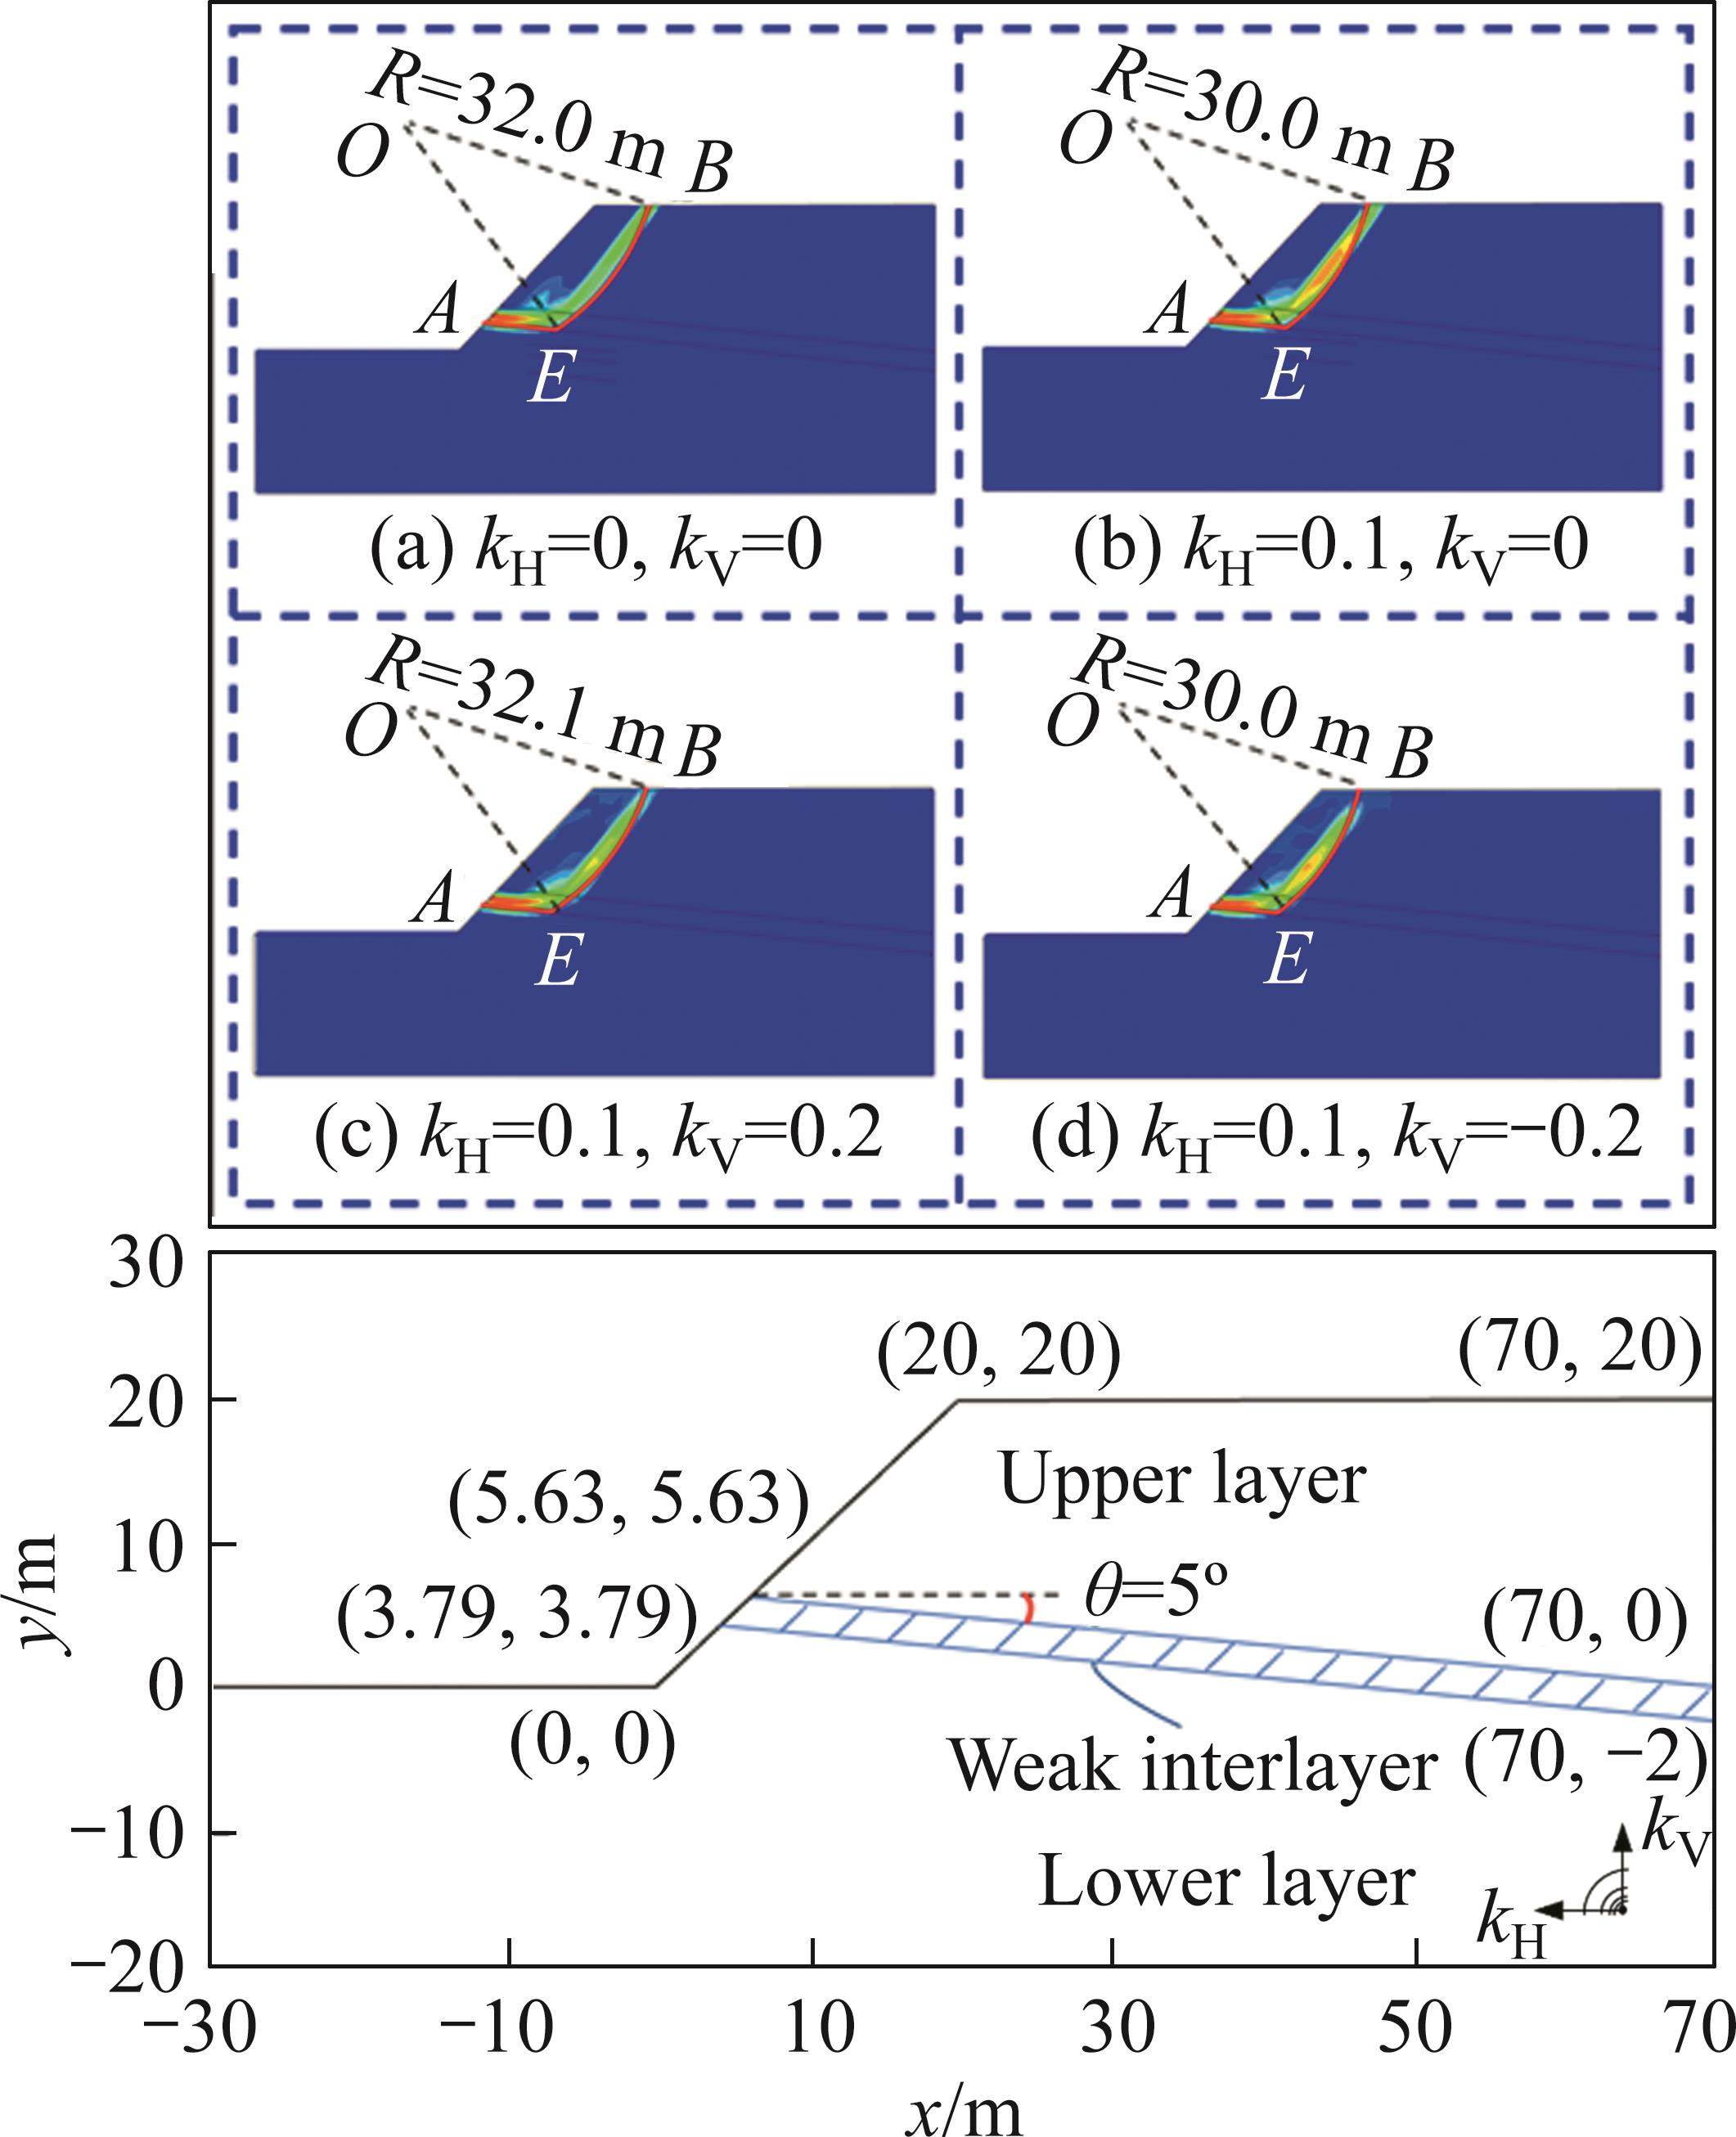
Slope example 6: As shown in Figure 11, a heterogeneous slope example is extracted from CHEN et al [47]. The example is a three-layer anticline rock slope with weak interlayer. The slope occurrence and rock mass parameters are listed in Table 9. Similar to the previous example, the stability analysis is performed using the software FLAC3D 6.0 [32] and the present method, considering different seismic forces. Table 9 shows the calculated minimum slope FOS. Moreover, Figure 11 displays the critical SS obtained by the present method, accompanied by the maximum shear strain rate cloud diagram that reflects the shear plastic zone of the slope derived from numerical simulation.
| H/m | β/(°) | kH | kV | Minimum slope FOS (Fs_min) | Difference/% | |
|---|---|---|---|---|---|---|
| FLAC3D | Present method | |||||
| 20 | 45 | 0.0 | 0.0 | 2.586 | 2.496 | 3.48 |
| 0.1 | 0.0 | 2.086 | 1.990 | 4.60 | ||
| 0.1 | 0.2 | 2.289 | 2.195 | 4.41 | ||
| 0.1 | -0.2 | 1.957 | 1.891 | 3.37 | ||
| Noting that: (1) γ=25 kN/m3, σc=10000 kPa, GSI=60, mi=8, and D=0.5 for the upper layer; (2) γ=22 kN/m3, σc=750 kPa, GSI=45, mi=6, and D=0.4 for the middle layer; and (3) γ=25 kN/m3, σc=10000 kPa, GSI=65, mi=6, and D=0.1 for the lower layer. | ||||||
From Tables 7-9, Figures 9-11, it can be observed that:
1) In example 4, the minimum slope FOS obtained through the present method is very close to the numerical results of FLAC2D 7.0, with a difference of within 4.0%. Furthermore, the present method accurately identifies the critical SS of the slope within the shear plastic zone, as indicated by the maximum shear strain rate cloud diagram from the numerical simulation analysis. Both results indicate that the potential failure range of the slope does not extend to the lower layer.
2) In example 5, the minimum slope FOS obtained using the present method is also in close agreement with the numerical results of FLAC3D 6.0, with a relative difference of within 5.0%. Additionally, the critical SS determined by the present method falls within the range of the shear plastic zone depicted by the maximum shear strain rate cloud diagram from the numerical simulation analysis. As the occurrence of the layer interface happens nearly horizontally, both results suggest that the potential failure range of the slope extends from the middle layer to the outer slope surface.
3) In example 6, the minimum slope FOS obtained through the present method closely aligns with the numerical results from FLAC3D 6.0, showing a relative difference of within 4.0%. Additionally, the critical SS determined by the present method generally falls within the range of the shear plastic zone, illustrated by the maximum shear strain rate cloud diagram from the numerical simulation analysis. Given that the rock slope includes a weak interlayer, both outcomes suggest that the potential failure range of the slope extends across the weak interlayer and along its interface to the outer slope surface. Unlike the other examples, this example assesses the applicability of the present method in analyzing slope stability under a combined sliding failure mode, involving straight SS in section AE and circular SS in section EB.
In conclusion, the suitability and feasibility of the present method are established by comparing the computed results with those obtained using the LEM, LAM, and NSM for both homogeneous and heterogeneous rock slopes. Furthermore, it is crucial to emphasize that the present method employs the NS function on the SS, which differs from the stress of the element in the numerical simulation analysis. Consequently, in comparison to numerical simulation software, the present method offers greater flexibility in integrating with the nonlinear strength criterion represented by the NS rather than the principal stress for slope stability assessments.
6 Conclusions
To enhance the effectiveness of stability analysis for rock slopes and determine their tension- and compression-shear failure characteristics, this study introduces a novel method for LE analysis on the rock slope stability under stress-based calculation mode for the SS. Through comparison and analysis, the rationality, feasibility, and superiority of the present method are verified, leading to the following conclusions:
1) The NS function on the SS is constructed by analyzing the NS composition on the SS and utilizing Taylor series expansion. By combining the mechanical equilibrium equations of the sliding body and the stress constraint conditions at both ends of the SS, a stress solution for the SS, which closely approximates the NSM, is obtained. The present method allows for a reasonable simulation of the tension-shear stress zone of the SS near the slope top and an intuitive reflection of the concentration effect of compression-shear stress near slope toe.
2) In comparison to the traditional LEMs, the present method effectively tackles the technical obstacle of integrating the nonlinear GHB strength criterion directly into slope stability analysis. Moreover, it offers a comprehensive explanation of failure mechanisms encompassing both tension-shear and compression-shear in slopes.
3) In comparison to the variational method, the present method incorporates the stress constraint conditions at both ends of the SS, which possess greater physical and mechanical significance. This inclusion enables the accurate detection of tension- and compression-shear failure characteristics of the slope.
4) By combining the NS function on the SS with a loop iteration strategy, a mutual feedback mechanism is established between the NS and the strength parameters of the SS. This mechanism establishes a one-to-one relationship, effectively capturing the influence of the nonlinear characteristics of the strength criterion on the slope stability.
Limit equilibrium stability analysis of slopes under external loads
[J]. Journal of Central South University, 2016, 23(9): 2382-2396. DOI: 10.1007/s11771-016-3297-4.Limit equilibrium analysis of slope stability with coupling nonlinear strength criterion and double-strength reduction technique
[J]. International Journal of Geomechanics, 2019, 19(6):Comparative study of material point method and upper bound limit analysis in slope stability analysis
[J]. Transportation Safety and Environment, 2020, 2(1): 44-57. DOI: 10.1093/tse/tdaa002.Upper bound limit analysis of active earth pressure with different fracture surface and nonlinear yield criterion
[J]. Theoretical and Applied Fracture Mechanics, 2007, 47(1): 46-56. DOI: 10.1016/j.tafmec.2006.10.003.A novel creep contact model for rock and its implement in discrete element simulation
[J]. Computers and Geotechnics, 2024, 167: 106054. DOI: 10.1016/j.compgeo.2023.106054.Slope stability analysis using kinematic, limit equilibrium, and finite element models at Dessie town, northern Ethiopia
[J]. Arabian Journal of Geosciences, 2023, 16(12): 675. DOI: 10.1007/s12517-023-11783-6.Rockhead profile simulation using an improved generation method of conditional random field
[J]. Journal of Rock Mechanics and Geotechnical Engineering, 2022, 14(3): 896-908. DOI: 10.1016/j.jrmge.2021.09.007.Variational method for determining slope instability based on the strength reduction method
[J]. Bulletin of Engineering Geology and the Environment, 2022, 81(10): 395. DOI: 10.1007/s10064-022-02895-6.Stability analysis of slope based on limit equilibrium method and strength reduction method
[J]. Annales de Chimie - Science Des Matériaux, 2021, 45(5): 379-384. DOI: 10.18280/acsm.450503.A three-dimensional slope stability analysis method based on finite element method stress analysis
[J]. Engineering Geology, 2021, 280: 105910. DOI: 10.1016/j.enggeo.2020.105910.System reliability analysis of seismic pseudo-static stability of rock wedge based on nonlinear barton—Bandis criterion
[J]. Journal of Central South University, 2020, 27(11): 3450-3463. DOI: 10.1007/s11771-020-4558-9.A new nonlinear empirical strength criterion for rocks under conventional triaxial compression
[J]. Journal of Central South University, 2021, 28(5): 1448-1458. DOI: 10.1007/s11771-021-4708-8.The Hoek–Brown failure criterion and GSI–2018 edition
[J]. Journal of Rock Mechanics and Geotechnical Engineering, 2019, 11(3): 445-463. DOI: 10.1016/j.jrmge.2018.08.001.Pseudostatic stability analysis of rock slopes using variational method
[J]. Indian Geotechnical Journal, 2021, 51(5): 935-951. DOI: 10.1007/s40098-020-00475-7.Limit analysis slope stability with nonlinear yield condition
[J]. International Journal for Numerical and Analytical Methods in Geomechanics, 1988, 12(3): 341-345. DOI: 10.1002/nag. 1610120307.Variability effect of strength and geometric parameters on the stability factor of failure surfaces of rock slope by numerical analysis
[J]. Arabian Journal of Geosciences, 2020, 13(21): 1112. DOI: 10.1007/s12517-020-06080-5.Limit state analysis of stepped sliding of jointed rock slope based on tensile-shear composite failure mode of rock bridges
[J]. Bulletin of Engineering Geology and the Environment, 2022, 81(6): 233. DOI: 10.1007/s10064-022-02731-x.The effect on the stress distribution of the slope for rock and soil characteristics
[J]. Advanced Materials Research, 2014, 1065-1069: 227-231. DOI: 10.4028/www.scientific.net/amr.1065-1069.227.General slope stability analysis
[J]. Journal of the Soil Mechanics and Foundations Division, 1968, 94(6): 1253-1270. DOI: 10.1061/jsfeaq.0001196.Improved Bell’s method for the stability analysis of slopes
[J]. International Journal for Numerical and Analytical Methods in Geomechanics, 2009, 33(14): 1673-1689. DOI: 10.1002/nag.794.Limit equilibrium slope stability analysis using the nonlinear strength failure criterion
[J]. Canadian Geotechnical Journal, 2015, 52(5): 563-576. DOI: 10.1139/cgj-2014-0111.Limit equilibrium analysis incorporating the generalized Hoek-Brown criterion
[J]. Rock Mechanics and Rock Engineering, 2021, 54(9): 4407-4418. DOI: 10.1007/s00603-021-02518-8.Stability assessment of slopes in rock governed by the Hoek-Brown strength criterion
[J]. International Journal of Rock Mechanics and Mining Sciences, 2020, 127: 104217. DOI: 10.1016/j.ijrmms.2020.104217.Some difficulties associated with the limit equilibrium method of slices
[J]. Canadian Geotechnical Journal, 1983, 20(4): 661-672. DOI: 10.1139/t83-074.Novel model for limit-equilibrium analysis of slope stability with a nonlinear strength criterion
[J]. International Journal of Geomechanics, 2021, 21(9):Shear failure envelope of Hoek-Brown criterion for rockmass
[J]. Tunnelling and Underground Space Technology, 1998, 13(4): 453-458. DOI: 10.1016/S0886-7798(98)00088-1.Limit equilibrium solution for the rock slope stability under the coupling effect of the shear dilatancy and strain softening
[J]. International Journal of Rock Mechanics and Mining Sciences, 2020, 134: 104421. DOI: 10.1016/j.ijrmms.2020.104421.Determination of Mohr-coulomb shear strength parameters from generalized Hoek-Brown criterion for slope stability analysis
[J]. Rock Mechanics and Rock Engineering, 2012, 45(1): 123-129. DOI: 10.1007/s00603-011-0184-z.Influence of both anisotropic friction and cohesion on the formation of tension cracks and stability of slopes
[J]. Engineering Geology, 2019, 249: 31-44. DOI: 10.1016/j.enggeo.2018.12.016.Earthquake-induced displacement of cohesive-frictional slopes subject to cracks
[J]. IOP Conference Series: Earth and Environmental Science, 2015, 26:Non-linear shear strength reduction technique in slope stability calculation
[J]. Computers and Geotechnics, 2010, 37(3): 288-298. DOI: 10.1016/j.compgeo.2009.11.002.Limit equilibrium method based on an approximate lower bound method with a variable factor of safety that can consider residual strength
[J]. Computers and Geotechnics, 2011, 38(5): 623-637. DOI: 10.1016/j.compgeo.2011.02.010.Tensile strength, tension cracks, and stability of slopes
[J]. Soils and Foundations, 1981, 21(2): 1-17. DOI: 10.3208/sandf1972.21.2_1.Homogeneous soil slope stability analysis based on variational method
[J]. Rock and Soil Mechanics, 2019, 40(8): 2931-2937. DOI: 10. 16285/j.rsm.2018.0788.Comparisons of safety factors for slope in nonlinear soils
[J]. KSCE Journal of Civil Engineering, 2021, 25(10): 3737-3749. DOI: 10.1007/s12205-021-0298-0.Limit equilibrium method for rock slope stability analysis by using the generalized Hoek–Brown criterion
[J]. International Journal of Rock Mechanics and Mining Sciences, 2016, 89: 176-184. DOI: 10.1016/j.ijrmms.2016.09.007.Effect of rock mass disturbance on the stability of rock slopes using the Hoek-Brown failure criterion
[J]. Computers and Geotechnics, 2011, 38(4): 546-558. DOI: 10.1016/j.compgeo.2011.03.003.Modifications to the geological strength index (GSI) and their applicability to stability of slopes
[J]. International Journal of Rock Mechanics and Mining Sciences, 1999, 36(6): 743-760. DOI: 10.1016/S0148-9062(99)00043-1.Chart-based slope stability assessment using the Generalized Hoek-Brown criterion
[J]. International Journal of Rock Mechanics and Mining Sciences, 2013, 64: 210-219. DOI: 10.1016/j.ijrmms.2013.09.002.Stability charts for pseudostatic stability analysis of rock slopes using the nonlinear hoek-brown strength reduction technique
[J]. Advances in Civil Engineering, 2020(1): 8841090. DOI: 10. 1155/2020/8841090.A mathematical model based on artificial neural networks to predict the stability of rock slopes using the generalized hoek-brown failure criterion
[J]. Geotechnical and Geological Engineering, 2020, 38(1): 587-604. DOI: 10.1007/s10706-019-01049-y.Stability of seismically loaded slopes using limit analysis
[J]. Géotechnique, 2003, 53(5): 463-479. DOI: 10.1680/geot.53. 5.463.37509.DENG Dong-ping, ZHANG Dian, PENG Yi-hang, CHEN Hao-yu declare that they have no conflict of interest.
DENG Dong-ping, ZHANG Dian, PENG Yi-hang, CHEN Hao-yu. An improved limit equilibrium method for rock slope stability analysis under stress-based calculation mode for slip surface [J]. Journal of Central South University, 2025, 32(1): 262-287. DOI: https://doi.org/10.1007/s11771-025-5852-3.
邓东平,张典,彭一航等.滑面应力模式下岩质边坡稳定性极限平衡法[J].中南大学学报(英文版),2025,32(1):262-287.

