1 Introduction
1.1 Background and motivation
Urban air pollution has become a common problem that people all over the world need to face, and its harm is multifaceted [1-3]. Air pollution will cause a variety of respiratory diseases, cardiovascular diseases, neurological diseases, and so on [4, 5]. In addition, air pollution has greatly affected the efficiency of social production, energy industry, tourism industry, and so on [6]. The emission of air pollutants also leads to the deterioration of the quality of the atmosphere [7]. Based on public health, economic development, ecological environmental protection, and other reasons, it is increasingly necessary to study urban air pollution [8]. Local governments and social organizations are also taking active measures to control air pollution. Predicting the trend of air pollution is considered an effective method [9]. Based on the characteristics of historical data, the prediction technology can explore the future fluctuation law of environmental pollutants, which provides an important scientific basis and support for the treatment and protection of air pollution [10, 11]. To deal with the problem of air pollution, many research institutions and scholars have invested a lot of research power to develop pollutant prediction technology [12-21].
1.2 Related works
The physical model simulates the processes related to atmospheric environment physics, biochemical reactions, and pollution emissions by invoking a large number of computing power resources [22, 23]. But complex atmospheric systems, local climates, and industrialization make it difficult for time-consuming physical models to be widely used [24]. In a new way, statistical models are widely utilized in air quality prediction because of their simplicity and efficiency [25, 26]. It includes autoregressive integrated moving average (ARIMA) [27], grey model [28], multivariate linear model [29], etc. However, some linear assumptions make it difficult for many statistical models to deal the data with rich nonlinear characteristics [30-32]. In this case, intelligent models stand out due to their excellent nonlinear processing capabilities [12], including artificial neural networks (ANNs) [33-35], fuzzy systems [36], deep learning [37-39], etc. Unfortunately, due to the strong spatial dispersion of air pollutants, such spatial correlation characteristics are often ignored by traditional AI models [40, 41]. To make up for the gap in the ability of traditional AI models in spatial modeling and pollutant spatial-temporal feature extraction, graph-based neural networks are developed. MANDAL et al [42] proposed an efficient clustering-based graph neural network spatio-temporal feature extraction method to deal with the spatial heterogeneity of PM2.5 data. Experiments show that this graph neural network based on spatial attention clustering can be a powerful way to predict PM2.5 concentration in highly polluted areas. QI et al [43] developed a hybrid method based on graph convolutional network (GCN) and long short-term memory (LSTM) to extract the spatially dependent features of different pollutant monitoring sites and capture the temporally dependent features between observations at different times. Experimental comparisons show that their model has the best average prediction value among different sites. DUN et al [44] proposed dynamic graph convolutional network and the multi-channel temporal convolutional network (DGC-MTCN) under the premise of considering the dynamic node relationship. The model fully extracts the temporal and spatial characteristics of PM2.5 data, effectively avoiding information leakage.
Research shows that most models focus on providing accurate PM2.5 point forecasts, i.e., deterministic forecasts. Point forecasts that can only reflect trend changes such as PM2.5 hourly or daily average values actually have a serious problem of loss of fluctuation information. Take the air quality index (AQI) of two days in Beijing, China as an example, the daily average value is 111, but the daily fluctuation range is 92-128 and 58-199 [1]. To obtain a more complete expression of PM2.5 fluctuation information, some interval prediction models, namely probabilistic prediction, have emerged [10, 45-47]. LIU et al [48] built a Dirichlet process mixture model (DPMM) algorithm to perform probabilistic prediction and simulation of PM2.5 concentration. The data of four pollutants from Tangshan City verify the predictive performance of the DPMM as excellent. WANG et al [49] used interval multi-layer perceptron (iMLP) to model the upper and lower boundaries of the components of deterministic forecasting. Range-based forecasting methods provide multiple information including volatility trend, uncertainty, and variability.
The above deterministic prediction and probabilistic prediction models have achieved valuable scientific research results, but there are still some gaps in the current related work:
1) Air pollutants are interactive and coherent, so it is very important to study the spatial mobility and correlation of PM2.5 to achieve accurate prediction. Few existing studies consider the impact of pollutant concentration changes at surrounding sites in the region on the concentration of particulate matter at the target site.
2) Conventional point prediction is easy to lose the key signal fluctuation information, while the accuracy of traditional interval prediction is difficult to meet the application requirements. It is very necessary to explore the interval prediction post-processing model based on high-precision point prediction.
1.3 Our contributions
This paper proposes a hybrid interval prediction model combining the spatio-temporal characteristics of PM2.5. The relevant contributions can be summarized as follows:
1) The proposed model strengthens the spatiotemporal analysis ability by fusing the surrounding PM2.5 spatial correlation information. Compared with traditional graph-based neural networks, the graph generative network (GGN) model designed based on graph U-nets architecture in this paper can generate highly complex and diverse graph data. The modeling process is extremely controllable and the model is interpretable. The advantage of being able to easily learn common features in the data makes it better adapt to new graphical data, thus having strong robustness.
2) The proposed model constructs the upper/lower bounds of the interval forecasts by sparse Bayesian regression kernel density estimation (SBR-KDE) based on the high-precision point forecasting. Different from the traditional kernel density estimation (KDE) interval prediction method, SBR-KDE can quickly process high-dimensional large-scale data due to its efficient storage and computing power. This enables the model to better cope with the prediction work of multi-site and multi-pollutant. In addition, SBR-KDE selects the location and number of storage and functions through a certain sparsity strategy, which ensures the prediction accuracy of the model to a great extent.
Section 1 summarizes the related works, and contributions of this paper. Section 2 elaborates the methodology of K-nearest neighbor (KNN) interpolation, graph generative network based graph U-nets, and SBR-KDE. Section 3 reports the framework of PM2.5 interval prediction model. Section 4 describes the research data, evaluation metrics, and experimental discussion. Section 5 draws the conclusion of the paper.
2 Methodology
2.1 KNN missing value imputation
The PM2.5 data collected by 34 Beijing air quality monitoring stations showed a small number of missing cases. In general, the hourly PM2.5 signal has continuity. To ensure the continuous and complete PM2.5 data of the target site and the auxiliary monitoring site, the KNN imputation method is utilized to fill the missing values [50, 51]. KNN calculates the distance between missing samples with missing values and other complete samples according to a certain distance function defined, including Euclidean distance and Mahalanobis distance. Based on these distance functions, the K samples closest to the missing sample can be found, and the information of these K samples can be used to estimate the missing value.
1) The Euclidean distance function is calculated as follows:
Euclidean distance in one-dimensional space 

where 

Euclidean distance in k-dimensional space 

where 


2) The Mahalanobis distance function 

where 


2.2 Graph generative network based graph U-Nets
The geographical distribution of different air quality monitoring stations is irregular, and graph-based neural network is very good at dealing with this kind of irregular spatial data. We take the PM2.5 data of 34 Beijing pollutant monitoring stations after interpolation and completion as input to construct the graph network structure.
To better extract the spatio-temporal characteristics of PM2.5 and make a deterministic prediction, GGN [52] is employed. GGN can process time-series meteorological data with complex dynamic structure and generate time-series prediction results with diversity and continuity. For GGN, the most critical parts are the generator and the discriminator [53, 54], where the generator generates new graph data, and the discriminator evaluates whether the data of the generator is real. Generators can be represented as follows:

where 


In addition, the discriminator can be expressed as follows:

where 


However, due to the unstable training process, GGN has the problem of gradient disappearance or explosion. To improve this short board, we combine graph U-nets [55, 56] with encoding-decoding architecture with GGN to enhance the controllability of the model to the graph generation process. The combination of the two can effectively improve the generation effect and efficiency of the model, and the stronger robustness makes it better adapt to the new graphical data.
The encoder in the graph U-nets encoding and decoding framework is provided as follows:

where 


The mathematical formula for the decoder is given as follows:

where 


2.3 Sparse Bayesian regression kernel density estimation
After graph generative network based graph U-nets (Graph U-nets GGN) modeling in the previous stage, PM2.5 point prediction results were obtained. In this study, to better exploit the unpredictable components in the residuals of deterministic modeling, probabilistic predictive modeling is used for quantitative analysis and estimation. The probabilistic prediction of PM2.5 signal is based on the point prediction output to calculate the upper and lower boundary, so as to obtain the prediction interval under the specified confidence level. Interval prediction can provide more reliable forecast information for air pollution management and reduce pollution hazards [57].
As a nonparametric probability density estimation method, KDE is widely used in the field of time series [58]. Compared with the traditional probabilistic prediction algorithm, the SBR-KDE method adopted in this section overcomes several defects of KDE: 1) the interval prediction performance of KDE decreases or even fails due to dimensional disasters; 2) the complexity increases due to the algorithm’s inability to distinguish between intensive training sets; 3) the lack of smoothness of KDE in the case of small sample training sets. A description of SBR-KDE, which is better at handling large-scale high-dimensional data, is provided as follows:
Assuming that 


where 

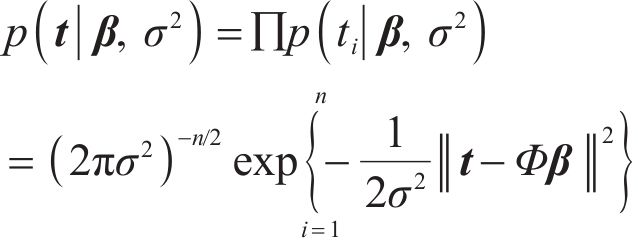
where 


To facilitate the application of SBR, the unit KDE [58] is rewritten in a more general form:

where 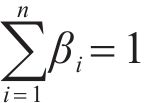
The correlation vector 


where 

3 Framework of PM2.5 interval prediction model
To obtain reliable PM2.5 interval prediction results, a KNN-graph U-nets GGN-SBR-KDE model is proposed in this paper.
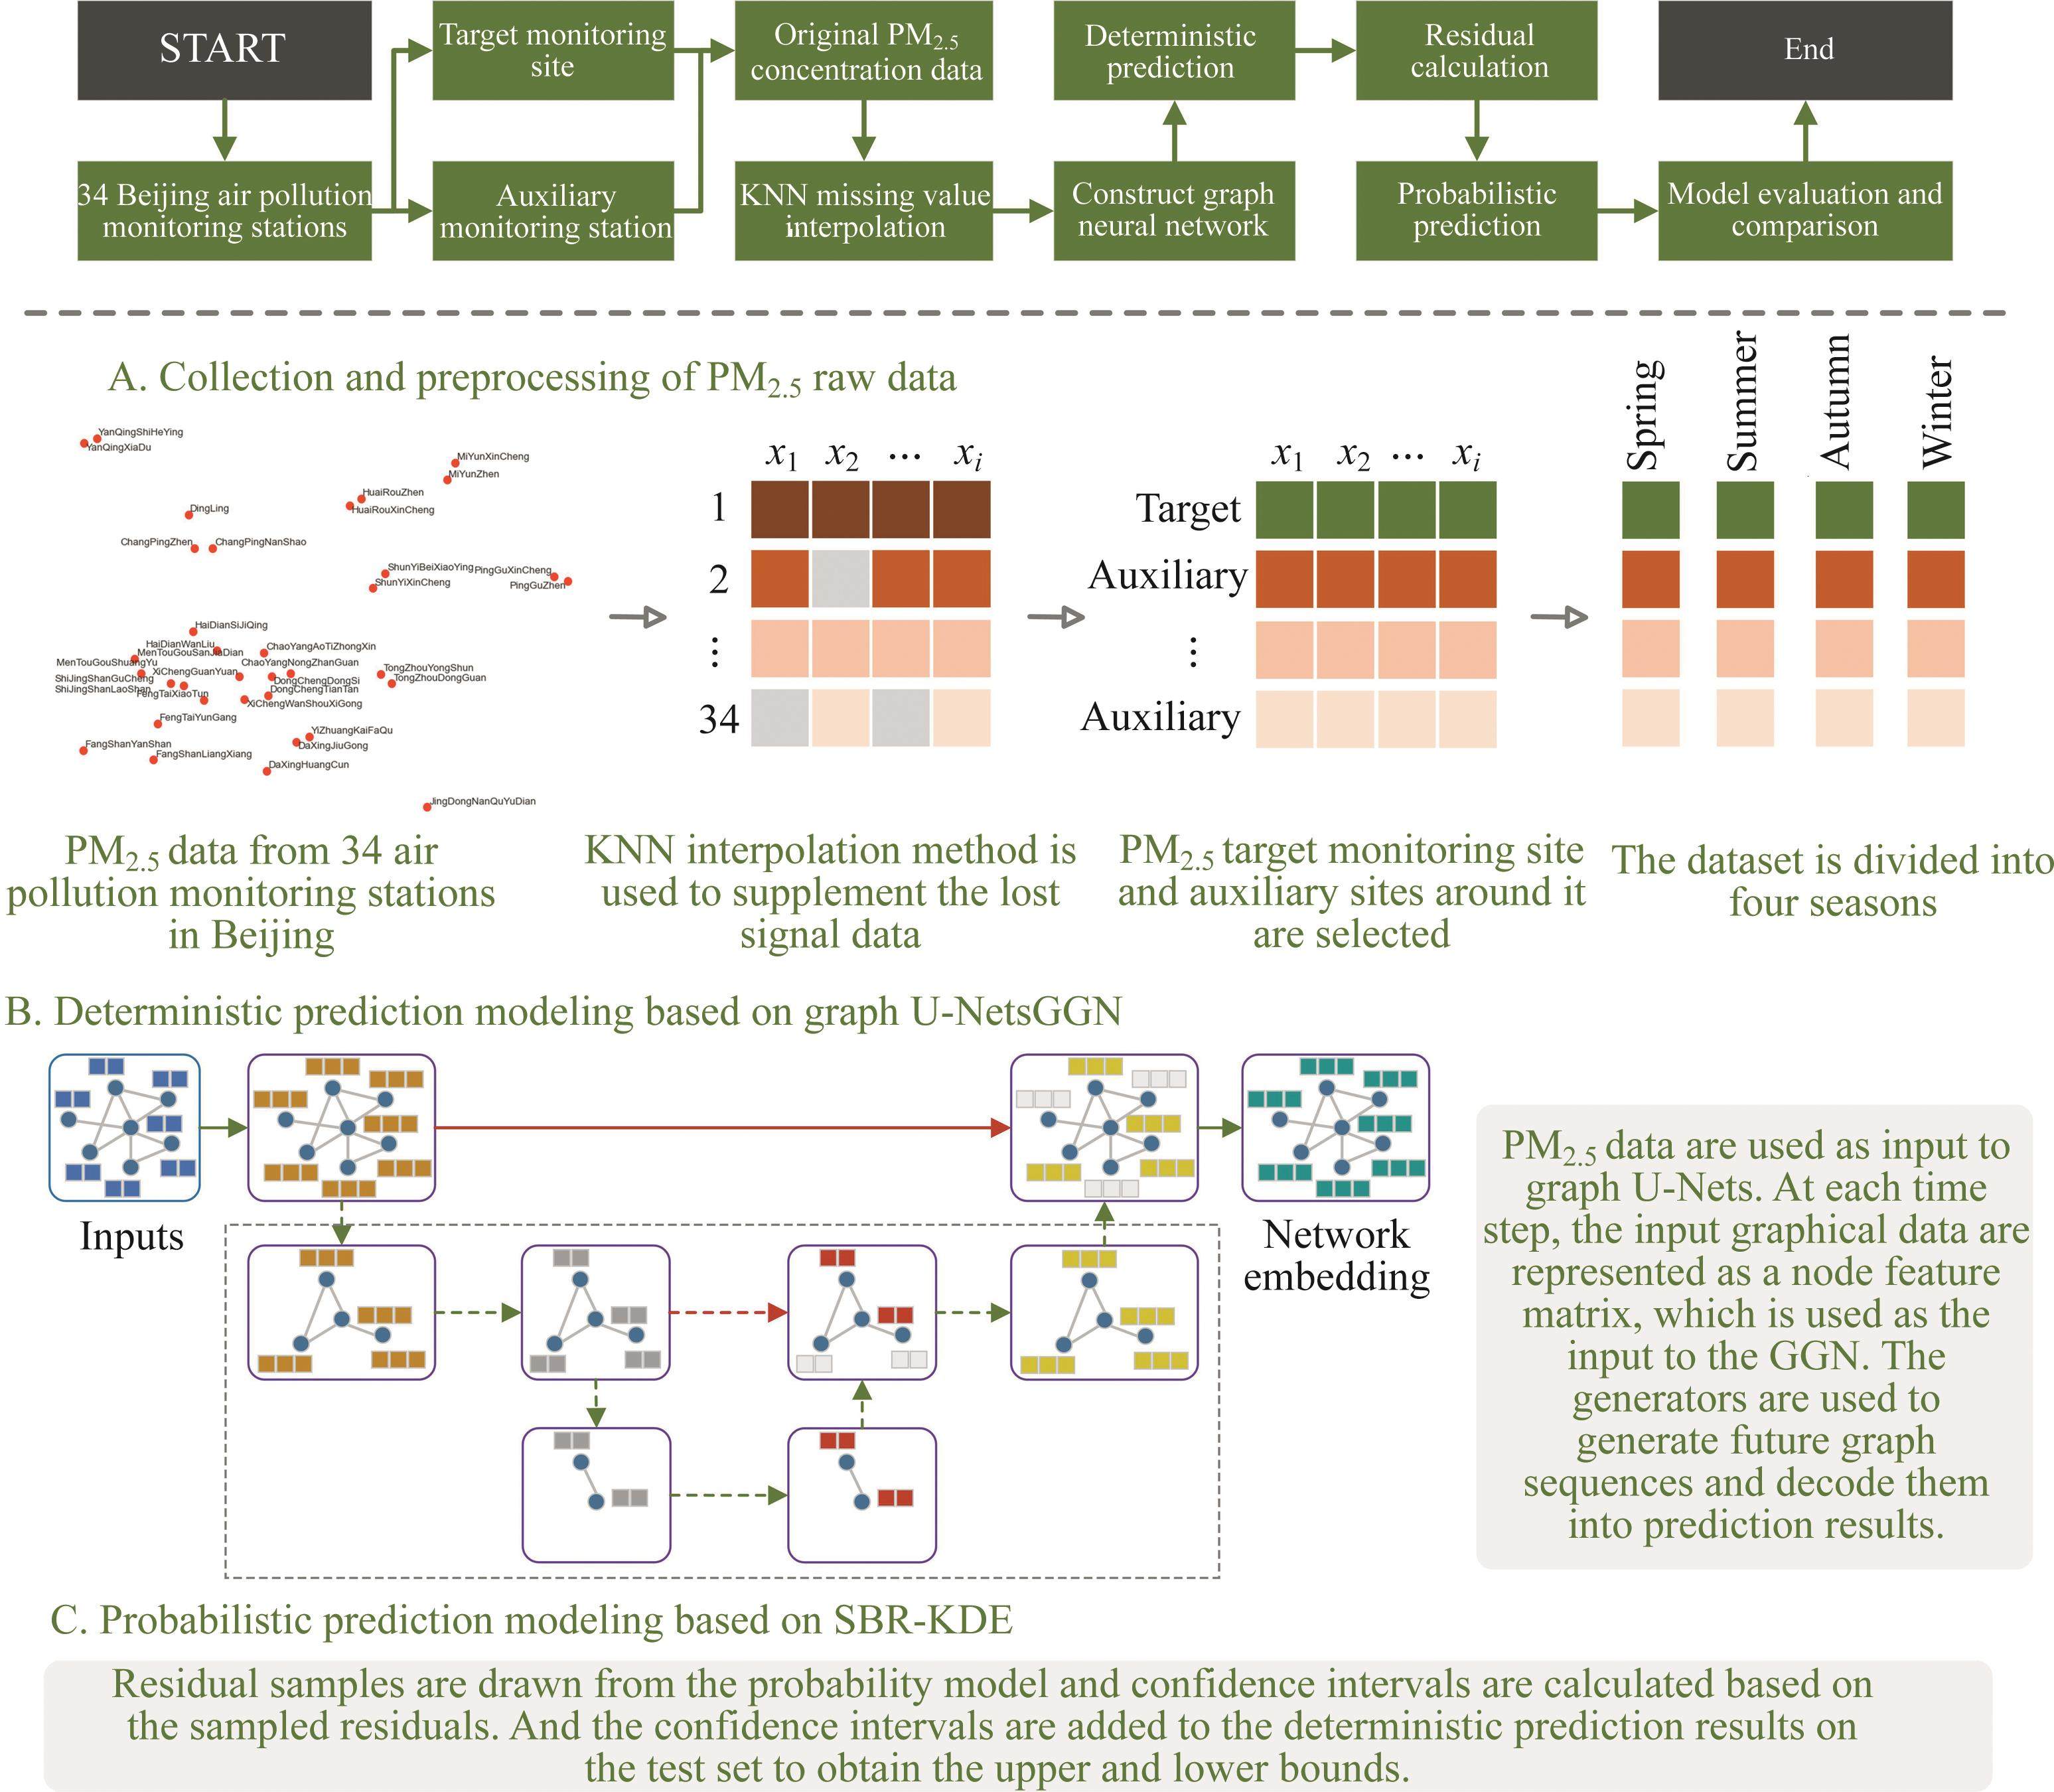
(a) PM2.5 data from 34 Beijing air quality monitoring stations are integrated as input to the graph-based network model. Among them, Dongchengdongsi is used as the target site for the prediction study, and the remaining 33 sites are used as auxiliary monitoring sites. To reduce the negative impact of blank missing values on predictive modeling, KNN imputation is used to perform missing value imputation. Considering the impact of data complexity on the stability of the model, the data set is divided into four seasons of spring, summer, autumn, and winter to comprehensively test the model. See Part A of graphic abstract for details.
(b) The GGN model with good interpretability is used to make PM2.5 point predictions at the target sites. The spatio-temporal data of the 34 sites are used as input to the graph generation model, and the deterministic prediction results of the target sites are used as output. To improve the instability of GGN training process, graph U-nets with encoding-decoding structures are embedded, which enables them to have extremely strong controllability in the graph generation process. See Part B of graphic abstract for details.
(c) To provide a more sufficient reference for air quality managers, SBR-KDE is utilized to model the interval prediction of the PM2.5 deterministic prediction residual. SBR-KDE overcomes the shortcomings of traditional KDE, and is better at processing high-dimensional large-scale data. During the study, confidence intervals are set at 90%, 95%, and 99%. See Part C of graphic abstract for details.
4 Results and discussions
4.1 Study objectives and data description
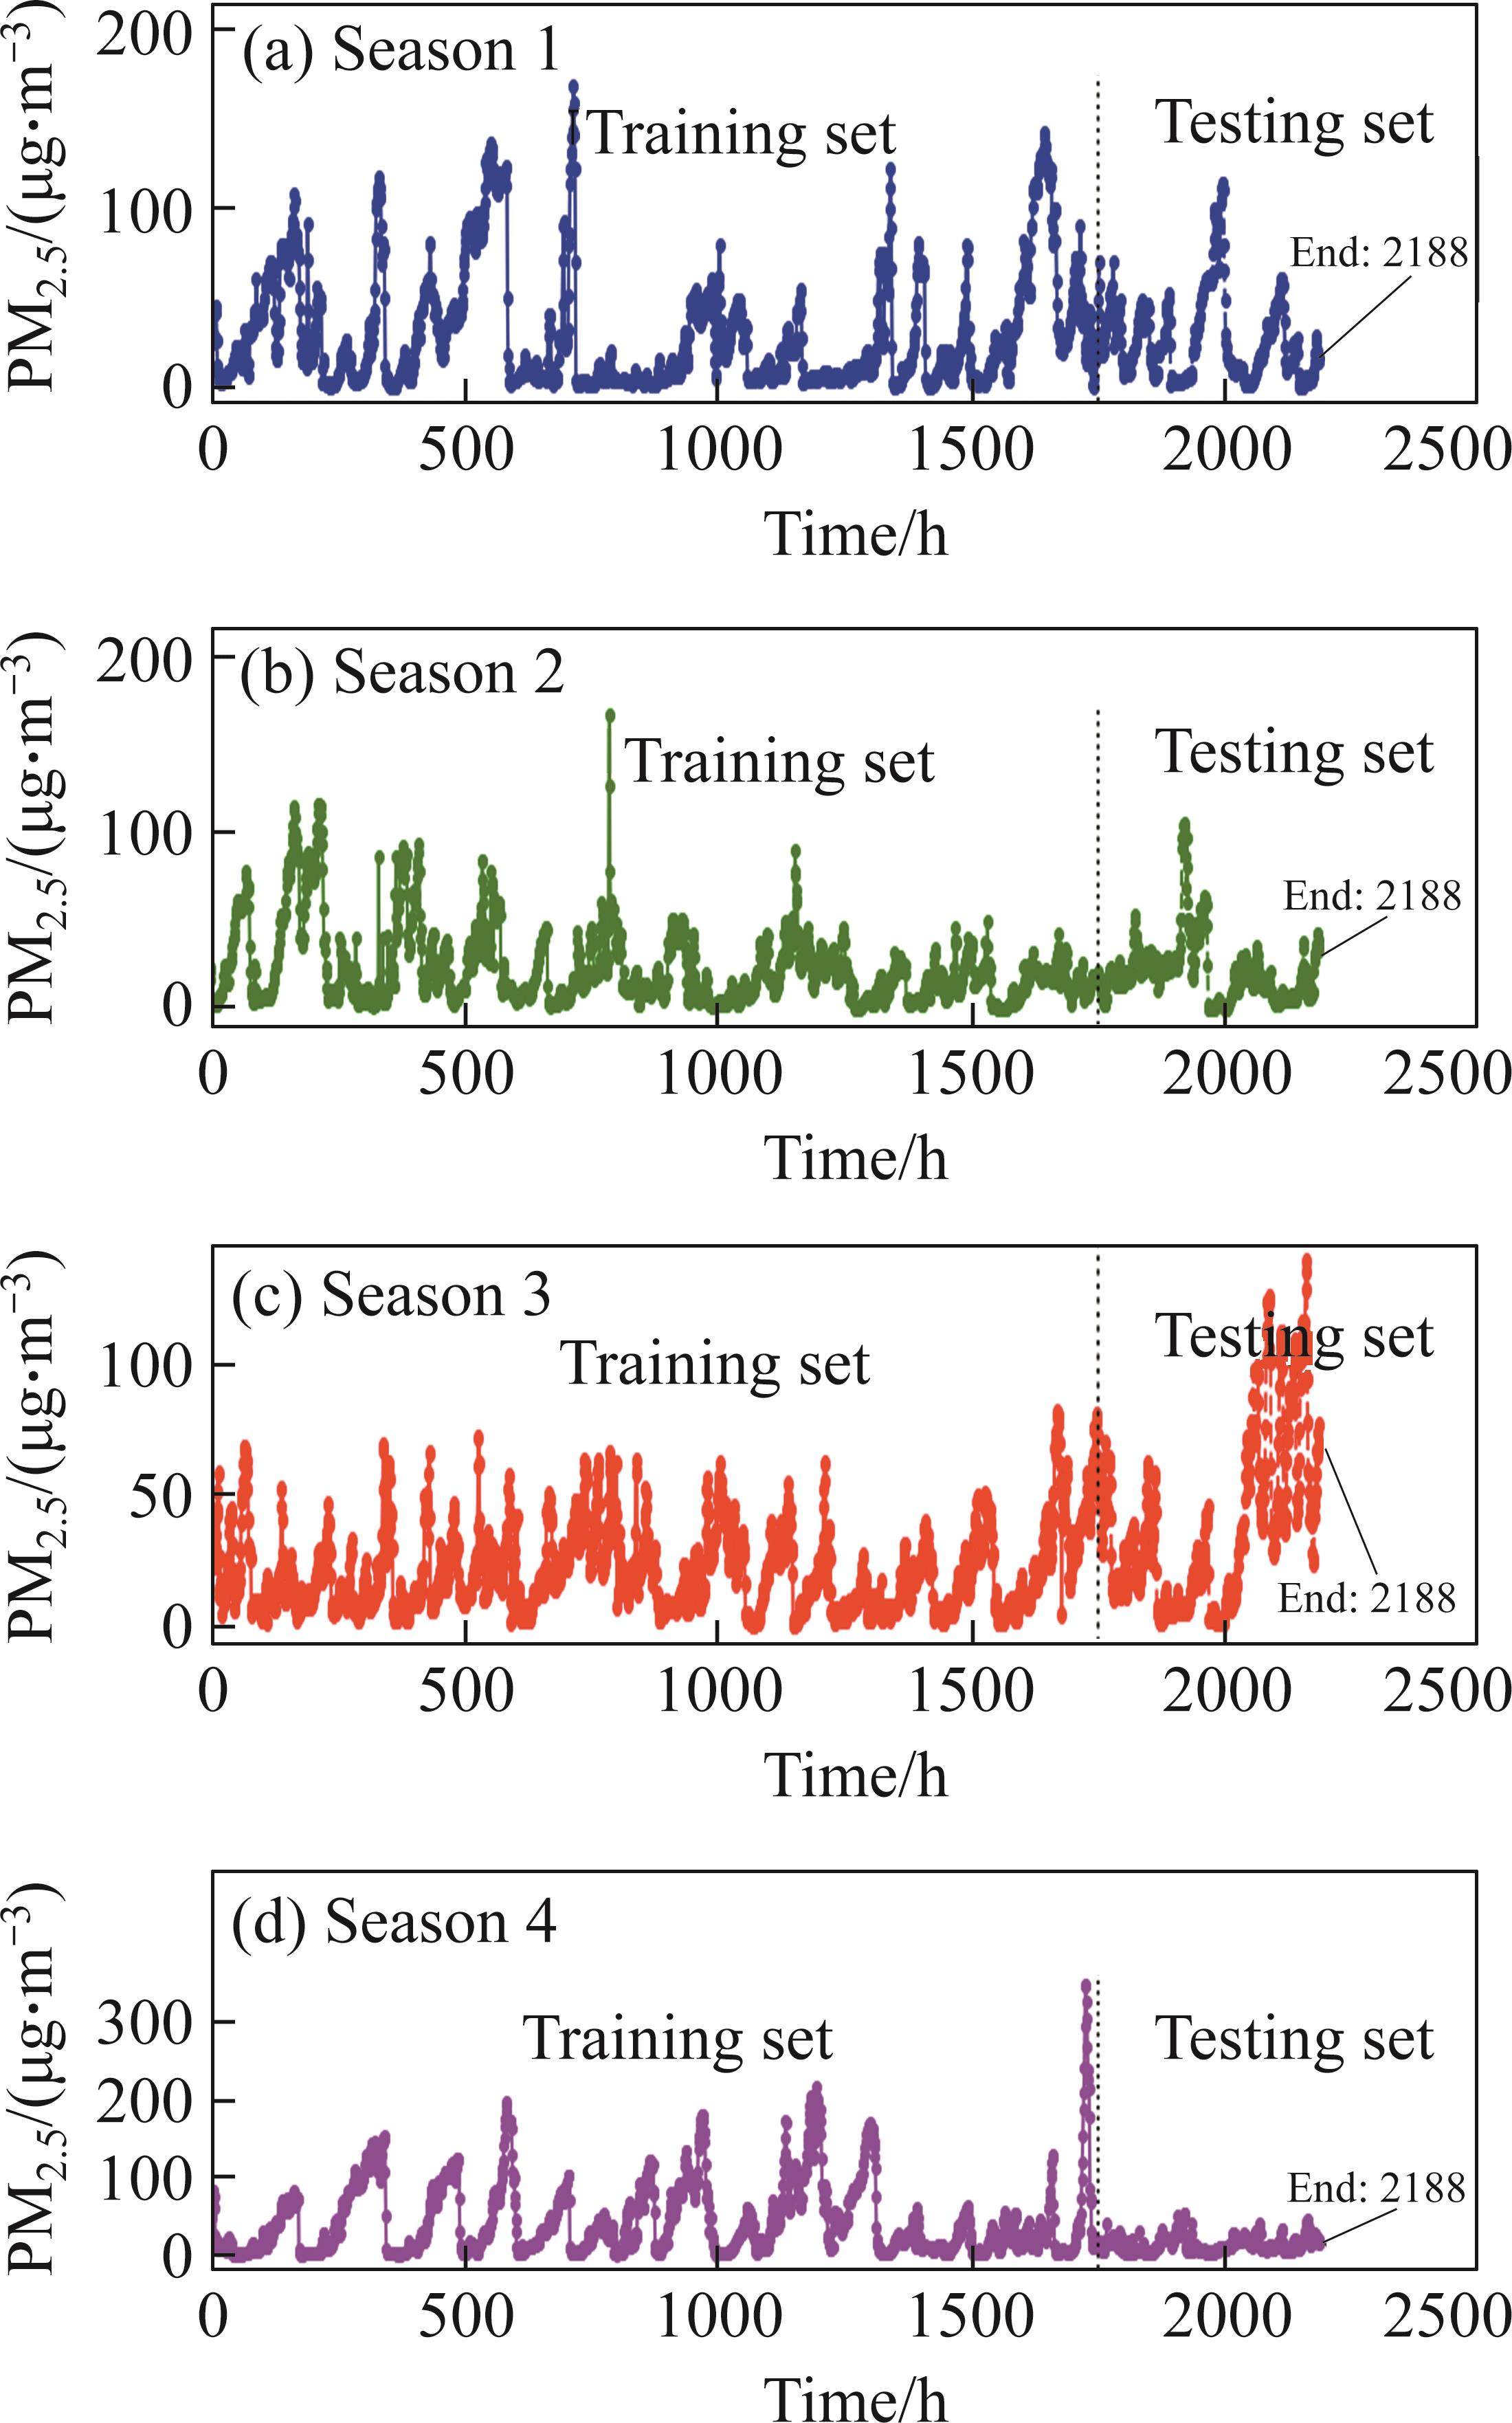
In this paper, the PM2.5 concentration data of Beijing are chosen as the research object to verify the performance of the interval prediction model. Beijing air quality data come from the website of Beijing Municipal Ecological and Environmental Monitoring Center (http://www.bjmemc.com.cn/). In this study, PM2.5 concentration dataset from 34 air quality monitoring sites in Beijing was collected, covering the four quarters of spring, summer, autumn, and winter in 2022. The length of the dataset for each quarter is 2188 sample points with a 1-hour sampling interval. The 1st-1750th are training data, and the 1751st-2188th are testing data.
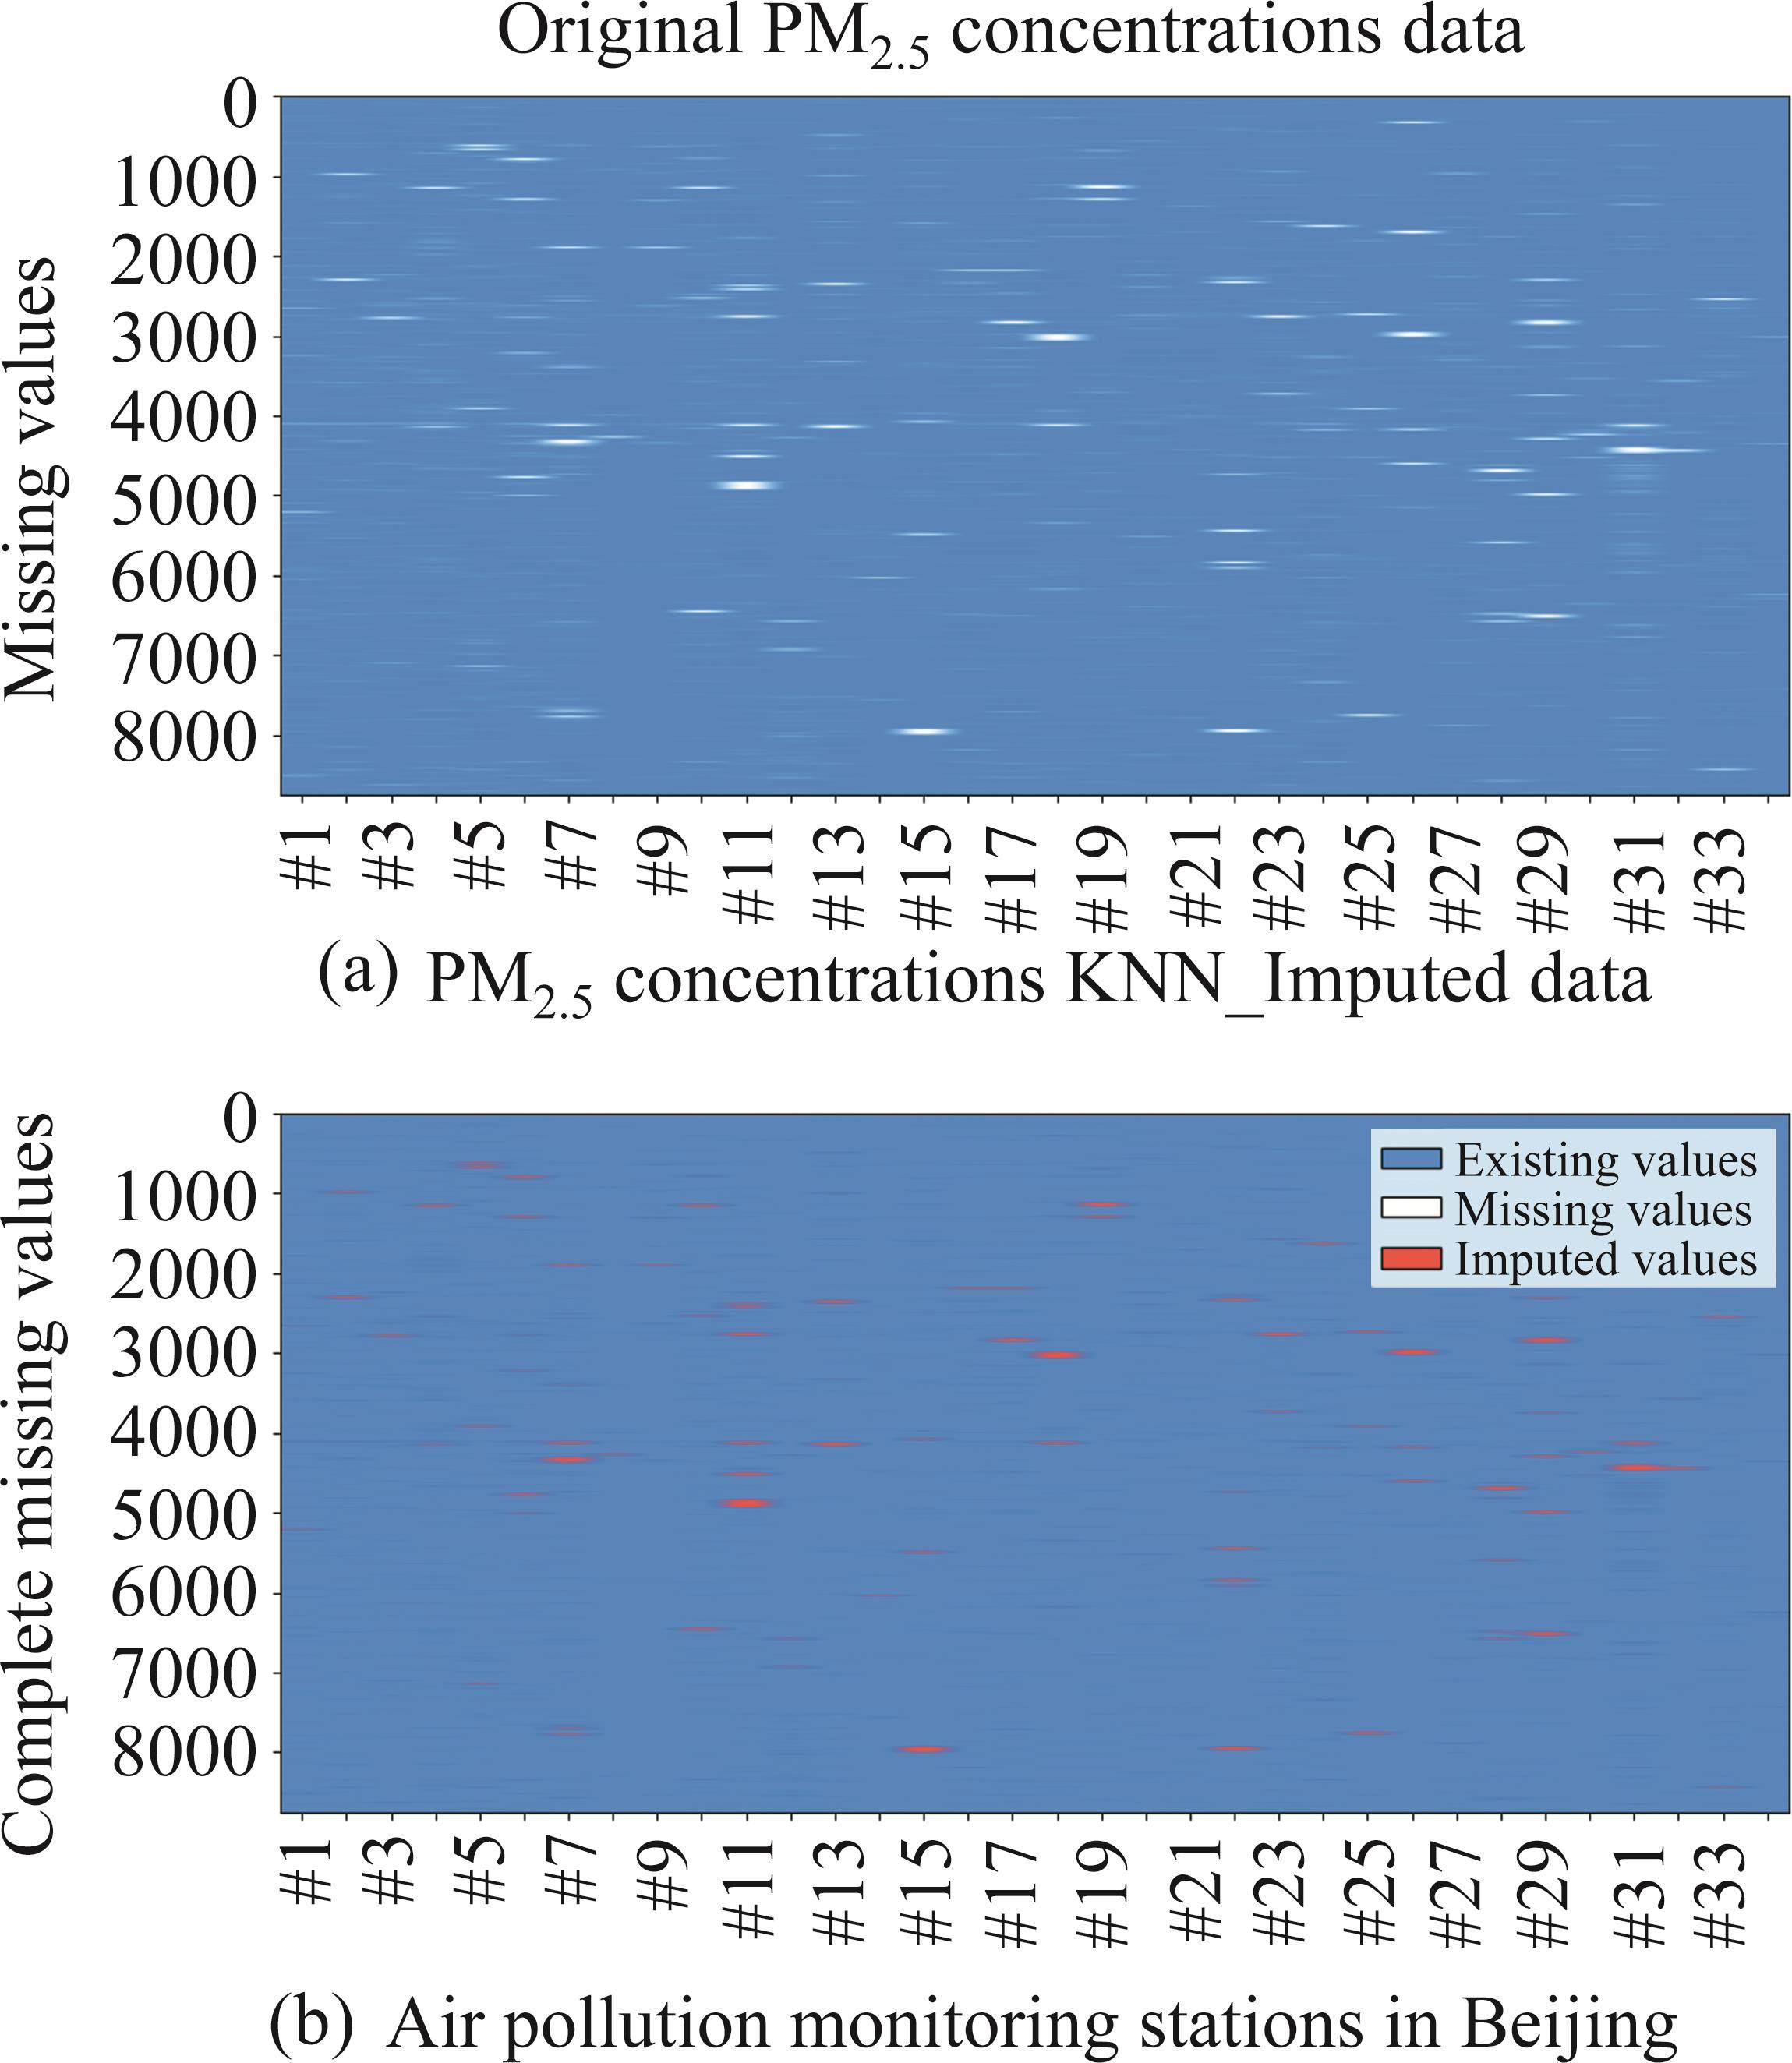
The PM2.5 concentration signals of 34 air pollution monitoring stations are more or less missing due to some reasons in the collection, transmission, and storage process. To maintain the consistency of the data, the KNN imputation method is employed to fill in the missing parts. Figure 1 shows the details of KNN interpolation filling for data from 34 sites. Blue represents collected PM2.5 data, white represents missing PM2.5 data, and red represents missing values interpolated by KNN. It is worth mentioning that the number of neighbors, k, of KNN is set to 20, the distance metric is set to Euclidean distance, and the weight parameter is distance weight.
In this paper, Dongchengdongsi (Longitude: 116.417°, Latitude: 39.929°) is selected as the target site for modeling research, and the remaining sites are set as auxiliary monitoring sites. More accurate prediction results of target sites can be obtained by combining the information of auxiliary monitoring sites. To more intuitively show the fluctuation of PM2.5 concentration data in the four seasons of Dongchengdongsi, Figure 2 is drawn. In addition, Table S1 in Supplementary materials presents the statistical calculation results of the PM2.5 dataset for each season. From the figure and table, it can be seen that there is a large difference in the data for different seasons. The rich data set can test the stability and adaptability of the model.
4.2 Performance evaluation metrics
In this part, the deterministic prediction error evaluation indexes and probabilistic prediction error evaluation indexes used in the experimental comparison are introduced respectively.
4.2.1 PM2.5 deterministic forecasting
Five air pollutant concentration assessment indicators, i.e., mean absolute error (MAE), mean absolute percentage error (MAPE), root mean square error (RMSE), Pearson’s correlation coefficient (R2), index of agreement (IA), are employed in the model performance test for the PM2.5 deterministic prediction. The smaller the value of the first three indicators, MAE, MAPE and RMSE, the better the effect of the model, and the closer the latter two indicators, R2 and IA, are to 1, the better the model is.


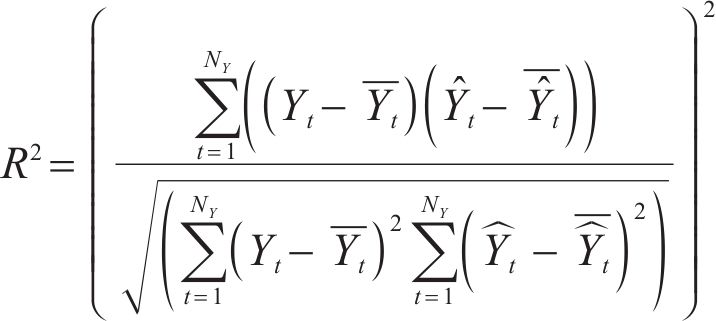
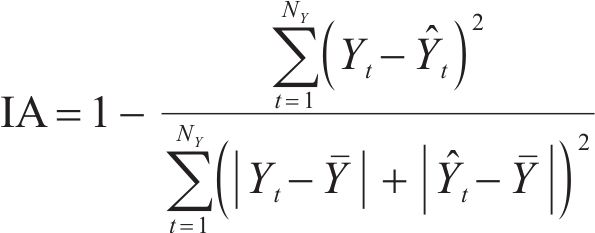
where 


4.2.2 PM2.5 probabilistic forecasting
To reasonably and comprehensively evaluate the pros and cons of model interval prediction performance, prediction interval coverage probability (PICP), prediction interval normalized average width (PINAW), coverage width-based criterion (CWC), and average coverage error (ACE) are adopted.


where 


4.3 Experimental study of the proposed model
To avoid the contingency introduced to modeling by a single data set, four quarters of PM2.5 data are used for each experiment.
4.3.1 Deterministic prediction based on graph U-nets GGN
In the deterministic prediction experiment, 6 graph-based network benchmark models are used to contrast with the graph U-nets GGN, including graph neural network (GNN), graph recurrent neural network (GraphRNN), GCN, spatial temporal graph convolutional network (STGCN), graph isomorphism network (GIN), and gated attention network (GaAN). The model of the graph-like neural network is more suitable to deal with the feature data of irregular nodes, which makes it show more satisfactory performance in dealing with the data of irregular distribution of air quality monitoring stations. Table 1 lists in detail the forecasting performance of each graph-like model on different seasonal data sets. Figure 3 shows the scatter plot of the prediction of PM2.5 in spring by different graph-based network models. Figure 4 shows the comprehensive prediction results of PM2.5 in spring by six benchmark models and graph U-nets GGN model, including trend fitting plot, prediction error plot, error radar plot, and box plot.
| Season | Model | Deterministic forecasting | |||
|---|---|---|---|---|---|
| MAE | MAPE | RMSE | R2 | ||
| Spring | GNN | 4.7464 | 15.7931 | 7.6395 | 0.9248 |
| Graph RNN | 13.4456 | 73.3908 | 21.7249 | 0.3919 | |
| GCN | 4.9419 | 15.3052 | 7.9506 | 0.9186 | |
| Spatial temporal GCN | 4.3213 | 14.5415 | 6.2813 | 0.9492 | |
| GIN | 3.2419 | 13.9272 | 7.9825 | 0.9179 | |
| GaAN | 3.9809 | 12.5353 | 7.4598 | 0.9283 | |
| Graph U-nets GGN | 2.7793 | 12.0284 | 4.4760 | 0.9742 | |
| Summer | GNN | 7.5511 | 26.6922 | 11.7115 | 0.7037 |
| Graph RNN | 9.1996 | 68.1227 | 16.8307 | 0.3881 | |
| GCN | 4.0373 | 18.4544 | 6.6225 | 0.9053 | |
| Spatial temporal GCN | 4.0970 | 15.8141 | 6.3564 | 0.9127 | |
| GIN | 2.0018 | 8.1972 | 3.5650 | 0.9725 | |
| GaAN | 3.1626 | 13.3031 | 5.5074 | 0.9345 | |
| Graph U-nets GGN | 1.0107 | 5.2661 | 2.0863 | 0.9906 | |
| Autumn | GNN | 10.5241 | 28.1028 | 15.8137 | 0.7543 |
| Graph RNN | 13.9409 | 21.6556 | 26.1644 | 0.3274 | |
| GCN | 7.8026 | 22.5562 | 12.2408 | 0.8528 | |
| Spatial temporal GCN | 6.7076 | 16.2824 | 10.3155 | 0.8955 | |
| GIN | 5.1681 | 18.6617 | 11.5168 | 0.8697 | |
| GaAN | 5.0661 | 16.5596 | 8.5377 | 0.9284 | |
| Graph U-nets GGN | 4.3097 | 15.4907 | 6.9811 | 0.9521 | |
| Winter | GNN | 2.2623 | 16.3045 | 3.7072 | 0.8569 |
| Graph RNN | 2.6502 | 20.4403 | 4.5088 | 0.7883 | |
| GCN | 2.5573 | 16.1773 | 4.3151 | 0.8061 | |
| Spatial temporal GCN | 2.2287 | 16.4805 | 3.5266 | 0.8705 | |
| GIN | 5.6415 | 40.9020 | 15.2361 | -1.4177 | |
| GaAN | 2.2055 | 16.0037 | 3.8263 | 0.8475 | |
| Graph U-nets GGN | 1.3780 | 10.9445 | 2.2175 | 0.9488 | |
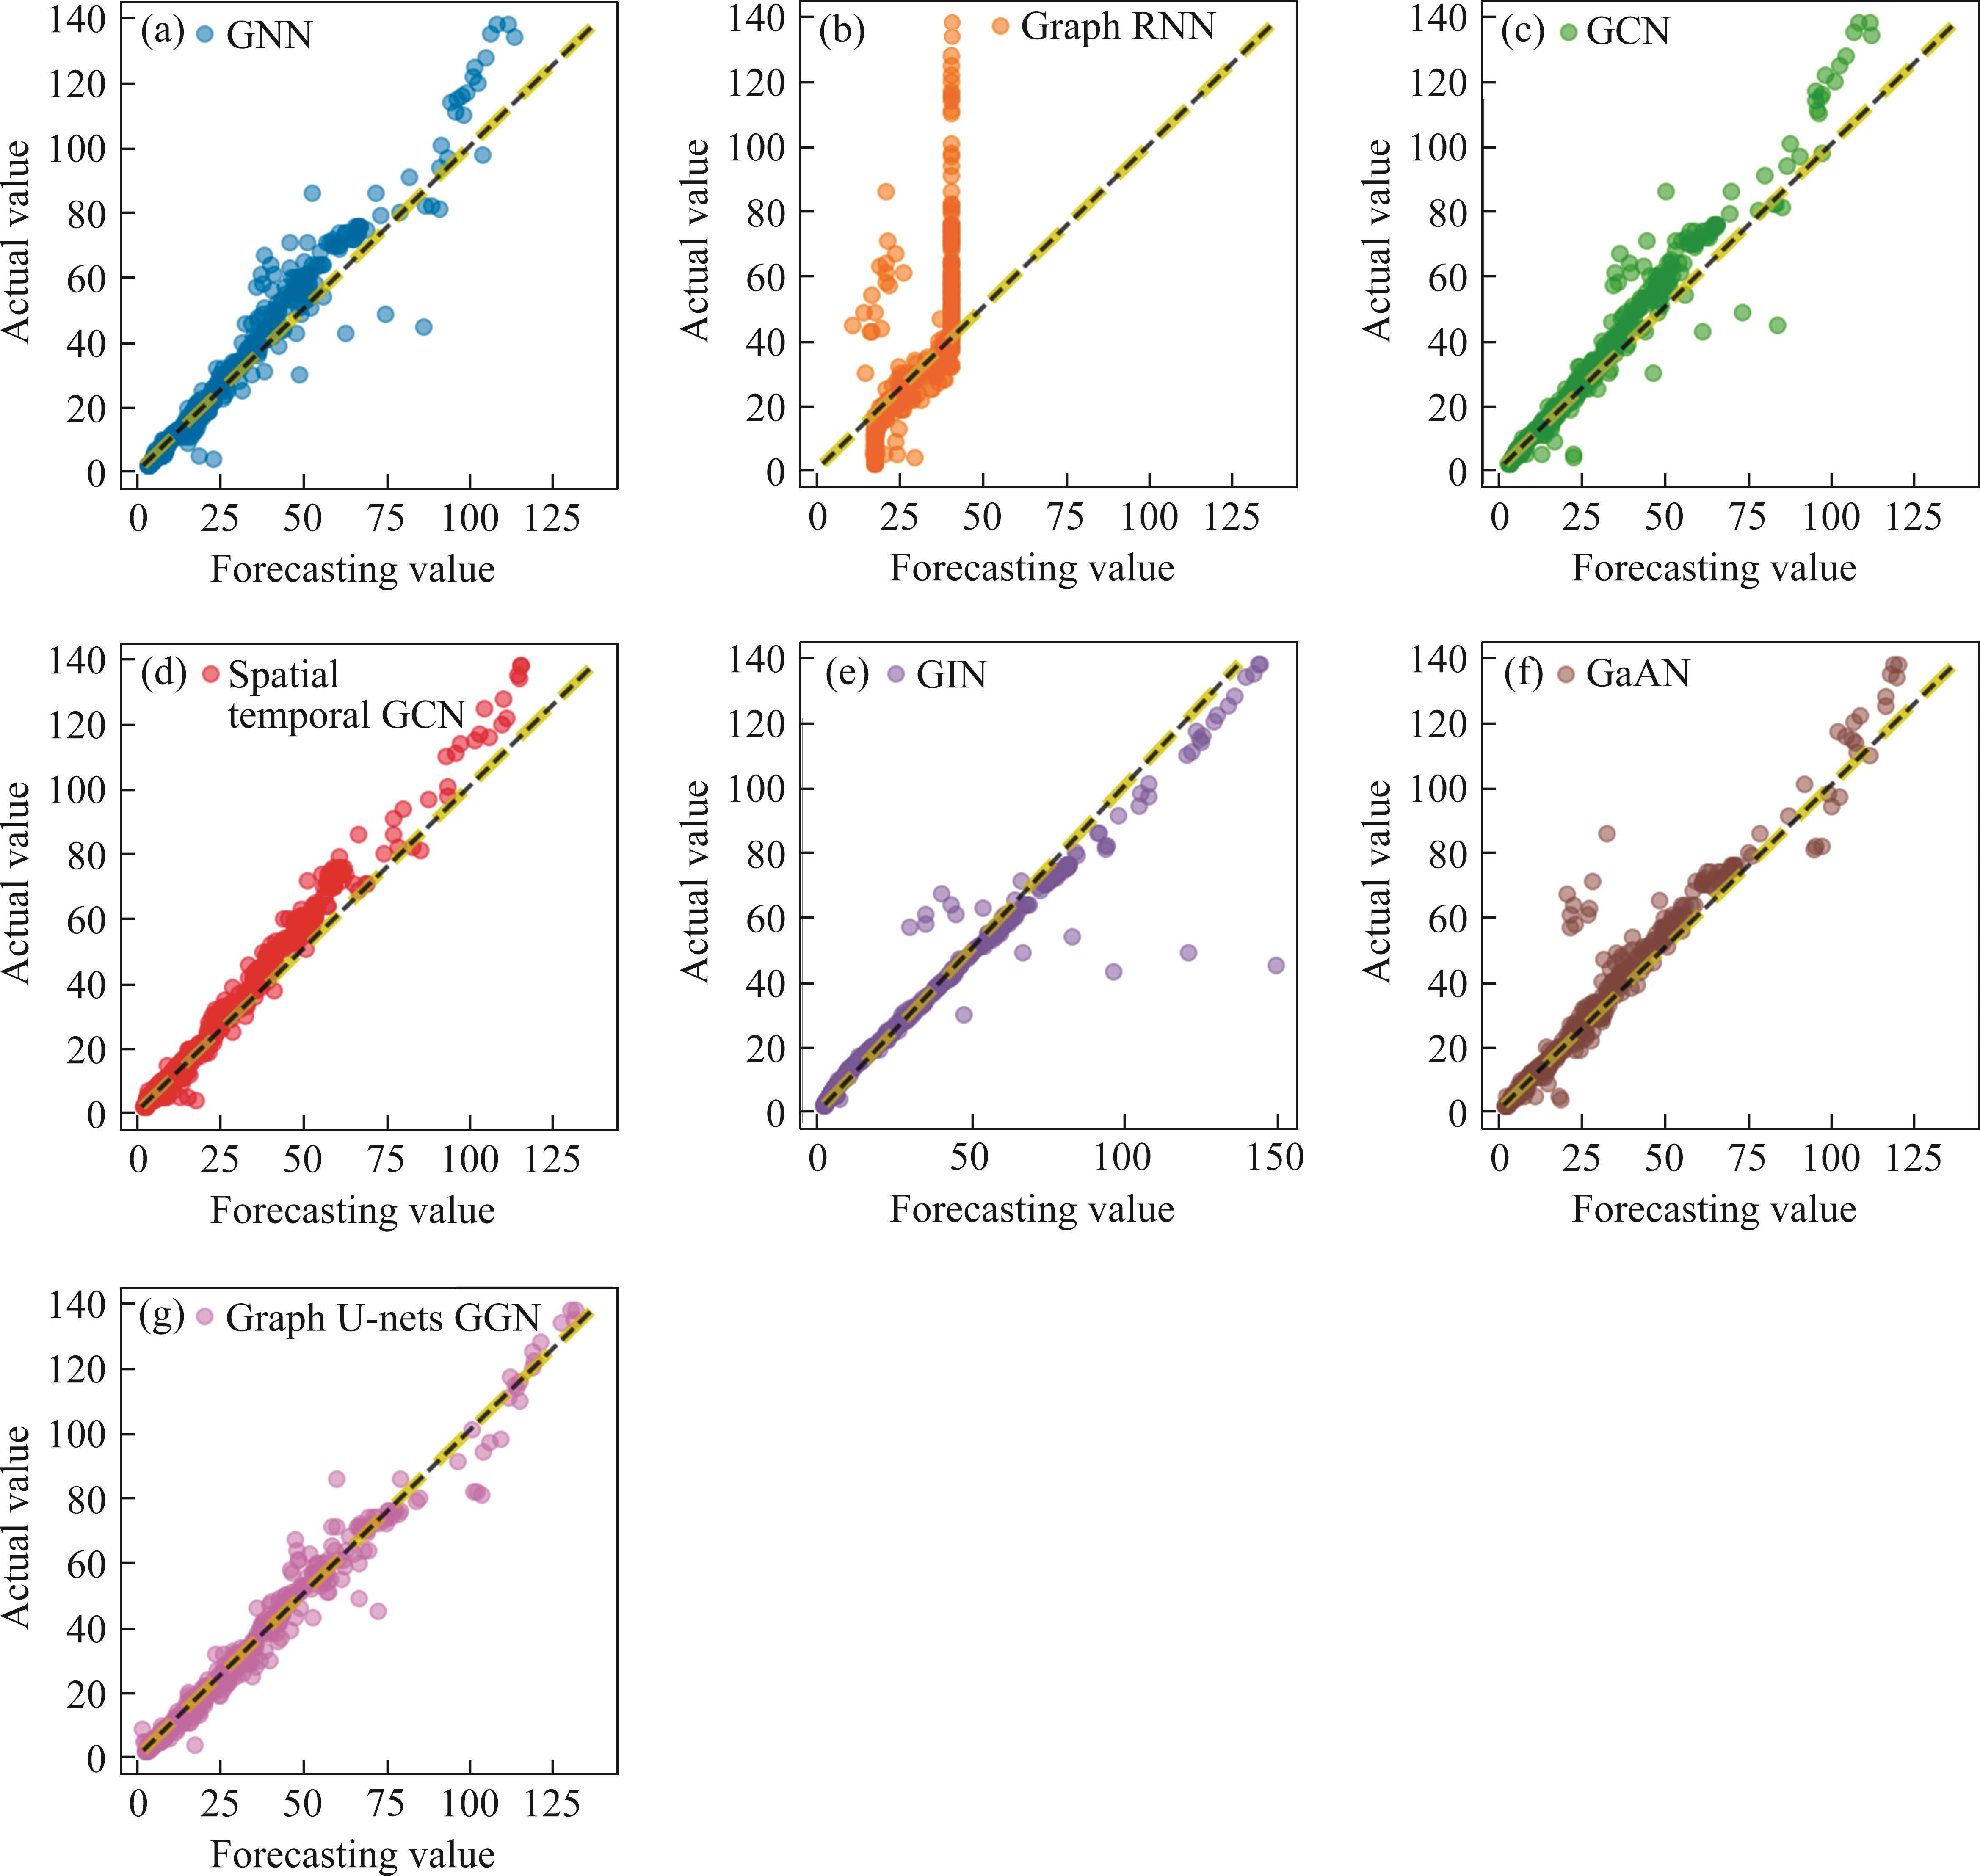
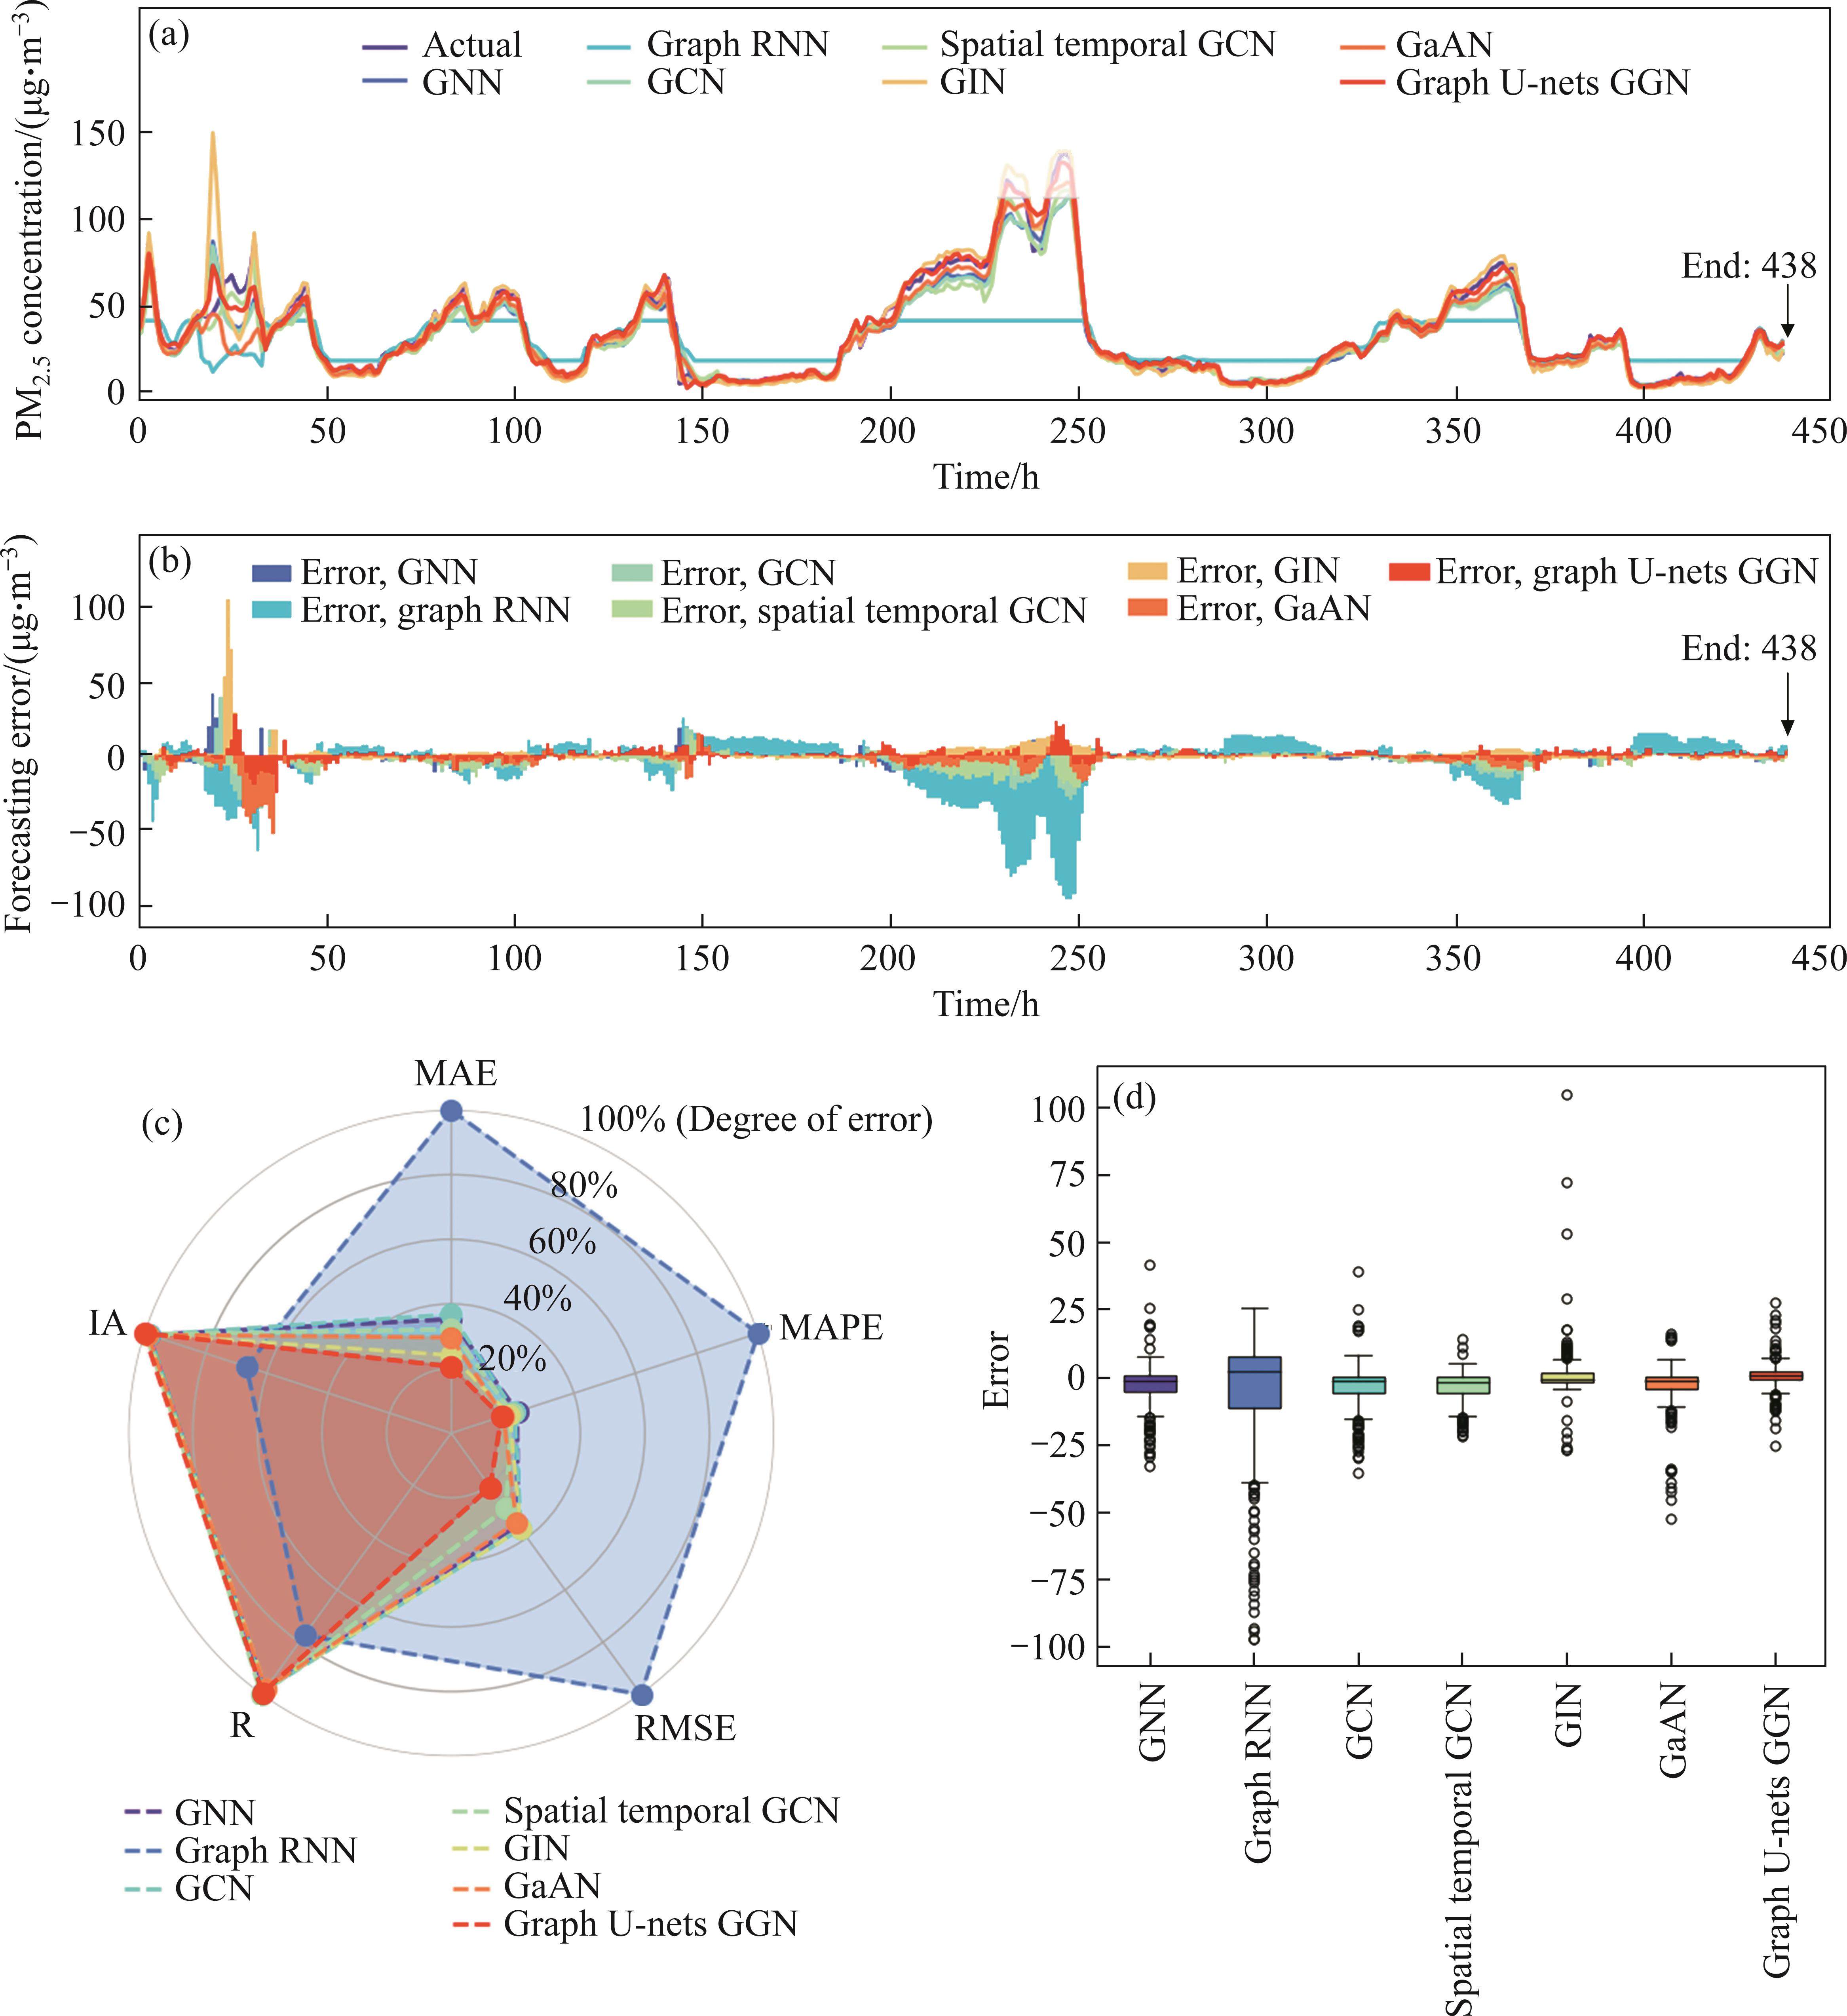
(a) Combined with the error-index statistics and curve trend, it can be found that graph RNN cannot well fit the real PM2.5 curve in most cases, and the GIN performs poorly in winter. The rest of the models are generally good. This may be because graph RNN is a model based on RNN, which is difficult to deal with abnormal situations such as node missing and node duplication. When there are anomalies in the input data, graph RNN may generate unreasonable graph data. Poor interpretability also makes the quality of the graphical data it generates difficult to assess. GIN is good at handling graphical data with different structures. However, GIN is based on global pooling and cannot capture local structural information in graph data. It is limited in its ability to capture local structural information. The above shortcomings may have led to the unstable performance of these two models.
(b) The proposed graph U-nets GGN shows the best results on the four PM2.5 datasets in spring, summer, autumn, and winter. Taking the error indicators of each graph-based network model on the spring PM2.5 dataset as an example, the MAEs of GNN, graph RNN, GCN, STGCN, GIN, GaAN, Graph U-nets GGN are 4.7464 μg/m3, 13.4456 μg/m3, 4.9419 μg/m3, 4.3213 μg/m3, 3.2419 μg/m3, 3.9809 μg/m3, 2.7793 μg/m3. The reasons for the excellent performance of graph U-nets GGN can be summarized as follows. Graph U-nets GGN combines the advantages of Graph U-nets and graph generative networks while avoiding their respective disadvantages. The graph U-nets structure adapts to graph data of different scales and shapes through adaptive pooling and upsampling operations. GGN can generate complex and diverse graphical data, and the model has good interpretability. Graph U-nets GGN can learn common features in the data by training on different graph data, which improves the robustness of the model. Multi-advantage fusion makes graph U-nets GGN superior to other graph-based network models on multiple data sets.
4.3.2 Probabilistic prediction based on SBR-KDE
It is often difficult to obtain satisfactory results by directly using probability models for interval forecasting. Interval forecasting modeling based on deterministic forecasting errors is a reasonable and feasible scheme. In this section, SBR-KDE is employed to perform interval prediction post-processing on the deterministic prediction results of the 7 graph-based network models in the previous section. Tables S2-S5 in Supplementary materials list in detail the statistical values of SBR-KDE interval prediction indexes obtained based on the deterministic forecasting results of each graph-based network model (Confidence interval: 90%). Figures S1-S4 in Supplementary materials show the interval forecast trend fitting plots of the proposed hybrid model (Confidence interval: 99%, 95%, 90%).
The PICP, PINAW, CWC, and ACE indexes in Tables S2-S5 in Supplementary materials show that the combination of SBR-KDE and graph-based network model can successfully complete the interval prediction task. The closer the value of PICP is to 1, the more real the values can be covered by the interval prediction results of the model. The smaller the value of PINAW, CWC, and ACE, the better. A smaller value of PINAW indicates a smaller width of the prediction interval of the model. A smaller value of CWC indicates a better balance between the width of the forecast interval and the coverage of the model. A smaller value of ACE indicates that the prediction interval coverage error of the model is smaller. The results of the tables show that the vast majority of interval forecasting results are acceptable. This is because SBR-KDE has the advantages of efficient storage and calculation, accurate probability density function estimation, good scalability, and strong interpretability. These advantages make SBR-KDE perform well in the problem of probability density function estimation for large-scale data.
In addition, comprehensively evaluating the four interval prediction evaluation indicators, it can be found that the proposed KNN-graph U-nets GGN-SBR-KDE shows the best performance. The interval prediction trend-fitting graph intuitively reflects the coverage of the upper and lower boundaries. Taking the spring PM2.5 interval prediction results of each model as an example, the CWCs of KNN-GNN-SBR-KDE, KNN-Graph RNN-SBR-KDE, KNN-GCN-SBR-KDE, KNN-spatial temporal GCN-SBR-KDE, KNN-GIN-SBR-KDE, KNN-GaAN-SBR-KDE, KNN-graph U-nets GGN-SBR-KDE are 0.9713, 1.6747, 0.9240, 0.7942, 0.4098, 0.5685, 0.3133, respectively. The reason for this phenomenon can be explained as follows. Since all interval predictions are carried out based on the deterministic forecasting results of the graph-based network model, the pros and cons of the deterministic prediction model will be further reflected in the interval prediction. The graph-based network model that performed better in the previous link will establish an advantage for interval prediction at this stage. Overall, the proposed hybrid model has good accuracy, robustness, and adaptability in interval forecasting.
4.3.3 Comparative experiments with other models
To more comprehensively evaluate the performance of the proposed KNN-graph U-nets GGN-SBR-KDE model, comparative experiments are set up. Generally, time series data are context-dependent, and contextual information will affect the model’s ability to capture changes in pollutant concentrations. Therefore, three models that consider temporal context are set up in the comparative experiment, including LSTM, gated recurrent unit (GRU), and LSTM-attention. In addition, State-Of-The-Art (SOTA) models for time series prediction are added for comparison, most of them are former or linear models, including sequence to sequence (seq2seq), deep linear (Dlinear), patch time series transformer (PatchTST) and mixer. Figure S5 in Supplementary materials shows the trend plots, error plots, radar plots and boxplots plots of these comparative models. Table S6 in Supplementary materials details the deterministic prediction results of LSTM, GRU, LSTM-attention, seq2seq, Dlinear, PatchTST, Mixer, and graph U-nets GGN models, as well as the SBR-KDE interval prediction results based on their sub-point predictions (Confidence interval: 90%).
Comparing the prediction result graph and error index table, it can be found that KNN-graph U-nets GGN-SBR-KDE is better than the seven compared models in comprehensive prediction performance. Taking the error indicators of each model (without KNN-*-SBR-KDE) on the spring PM2.5 dataset as an example, the MAEs of LSTM, GRU, LSTM-attention, seq2seq, DLinear, PatchTST, Mixer, and graph U-nets GGN are 12.2540 μg/m3, 14.4154 μg/m3, 11.0918 μg/m3, 12.4152 μg/m3, 2.9582 μg/m3, 6.5413 μg/m3, 2.9968 μg/m3, and 2.7793 μg/m3, respectively. Taking the error indicators of each model (with KNN-*-SBR-KDE) on the spring PM2.5 dataset as an example, the CWCs of LSTM, GRU, LSTM-attention, seq2seq, DLinear, PatchTST, Mixer, and graph U-nets GGN are 2.1528, 2.3203, 1.5124, 1.9220, 0.4442, 0.9617, 0.4457 and 0.3133. More accurate point forecasts generally lead to more accurate interval forecasts. After comparison with models that consider temporal data context and SOTA models, the effectiveness of the proposed hybrid model in time series prediction performance is fully verified.
4.3.4 Comparative experiment of Pinball Loss and MSE Loss
This paper proposes a hybrid model of interval prediction based on point prediction. However, an ideal interval prediction model can not only perform well in point prediction, but also accurately estimate the future uncertainty and consider the distribution of errors. In order to compare the performance of the models more comprehensively, we modified the MSE Loss of the MLP, convolutional neural network (CNN), Dlinear, LSTM, and LSTM-attention models to Pinball Loss to directly output the interval prediction results. The proposed model still implements interval prediction through SBR-KDE based on point prediction. Table S7 in Supplementary materials shows the comparison model results based on Pinball Loss and the interval prediction results of KNN-graph U-nets GGN-SBR-KDE.
Compared with the model that directly outputs the interval prediction results after changing the Loss function to Pinball Loss, the proposed probabilistic prediction model still performs best. Taking the probabilistic forecasting error indicators of each model on the spring dataset as an example, the CWCs of MLP, CNN, Dlinear, LSTM, LSTM- attention, and KNN-graph U-nets GGN-SBR-KDE are 0.6280, 0.3622, 0.6580, 0.4582, 0.3873 and 0.3133, respectively. The reason for this phenomenon may be that the proposed model is able to effectively capture the patterns and correlations in the data, which is the basis for the good performance of interval prediction. The SBR can reasonably consider the uncertainty of prediction through the Bayesian framework. The KDE structure does not rely on fixed distribution assumptions, and it can learn the distribution characteristics of the data more flexibly. In contrast, models such as MLP, CNN, DLinear, LSTM, and LSTM-attention, while powerful and versatile, often rely on fixed structural assumptions and optimization criteria. This may be less flexible and effective than SBR and KDE in handling highly nonlinear, non-normative distributions and uncertainty modeling.
5 Conclusions and future works
In this paper, a hybrid model of spatio-temporal characteristic interval prediction is proposed to serve the hourly forecast of PM2.5 in Beijing. The KNN missing value imputation strategy, the GGN method based on the graph U-nets architecture, and the SBR-KDE technology are integrated to build the model.
The experimental comparison of PM2.5 data in spring, summer, autumn, and winter shows that: 1) The proposed model can effectively combine the signals of auxiliary monitoring stations to obtain more reasonable PM2.5 prediction results of target stations. KNN algorithm can fill the data lost in the process of collection, transmission, and storage to ensure the continuity of data. 2) After embedding GGN into graph U-nets architecture, the training stability and controllability of the model are greatly improved, which solves the problem of gradient disappearance or explosion of GGN. Graph U-nets GGN shows the best deterministic prediction performance in each dataset environment, and this advantage also carries over to interval prediction. Its prediction performance is better than the compared GNN, graph RNN, GCN, spatial temporal GCN, GIN, and GaAN. 3) SBR-KDE technology improves the computational efficiency of the model through certain sparse strategies, which makes it also have excellent interval prediction ability when processing high-dimensional large-scale data. Interval forecasting modeling based on point forecasting is feasible and positive. The proposed hybrid model shows satisfactory accuracy and robustness in interval forecasting.
The work of this paper also has some limitations. The pollutant signals of some auxiliary monitoring sites may have a low correlation degree with the target site, which risks reducing the efficiency of the model. Screening and analysis of signals from surrounding stations are potentially effective means. In future research, we will focus on feature engineering.
A new perspective on air quality index time series forecasting: A ternary interval decomposition ensemble learning paradigm
[J]. Technological Forecasting and Social Change, 2023, 191: 122504. DOI: 10.1016/j.techfore.2023.122504.Impacts of aerosol direct effects on PM2.5 and O3 respond to the reductions of different primary emissions in Beijing-Tianjin-Hebei and surrounding area
[J]. Atmospheric Environment, 2023, 309: 119948. DOI: 10.1016/j.atmosenv.2023.119948.AI-based air quality PM2.5 forecasting models for developing countries: A case study of Ho Chi Minh City, Vietnam
[J]. Urban Climate, 2022, 46: 101315. DOI: 10.1016/j.uclim.2022.101315.Evaluation of air quality forecasting system FORAIR-IT over Europe and Italy at high resolution for year 2017
[J]. Atmospheric Pollution Research, 2022, 13(6): 101456. DOI: 10.1016/j.apr. 2022.101456.A flexible grey Fourier model based on integral matching for forecasting seasonal PM2.5 time series
[J]. Chaos, Solitons & Fractals, 2022, 162: 112417. DOI: 10.1016/j.chaos.2022.112417.Air quality forecasting with artificial intelligence techniques: A scientometric and content analysis
[J]. Environmental Modelling & Software, 2022, 149: 105329. DOI: 10.1016/j.envsoft.2022.105329.A hybrid deep learning framework for urban air quality forecasting
[J]. Journal of Cleaner Production, 2021, 329: 129660. DOI: 10.1016/j.jclepro.2021.129660.A spatial multi-resolution multi-objective data-driven ensemble model for multi-step air quality index forecasting based on real-time decomposition
[J]. Computers in Industry, 2021, 125: 103387. DOI: 10.1016/j.compind.2020.103387.Spatiotemporal air quality forecasting and health risk assessment over smart city of NEOM
[J]. Chemosphere, 2023, 313: 137636. DOI: 10.1016/j.chemosphere.2022.137636.Air quality deterministic and probabilistic forecasting system based on hesitant fuzzy sets and nonlinear robust outlier correction
[J]. Knowledge-Based Systems, 2022, 237: 107789. DOI: 10.1016/j.knosys.2021.107789.A graph-based LSTM model for PM2.5 forecasting
[J]. Atmospheric Pollution Research, 2021, 12(9): 101150. DOI: 10.1016/j.apr.2021.101150.A probabilistic forecasting approach for air quality spatio-temporal data based on kernel learning method
[J]. Applied Soft Computing, 2023, 132: 109858. DOI: 10.1016/j.asoc.2022. 109858.Prophet forecasting model: A machine learning approach to predict the concentration of air pollutants (PM2.5, PM10, O3, NO2, SO2, CO) in Seoul, South Korea
[J]. Peer J, 2020, 8:Prediction into the future: A novel intelligent approach for PM2.5 forecasting in the ambient air of open-pit mining
[J]. Atmospheric Pollution Research, 2021, 12(6): 101084. DOI: 10.1016/j.apr.2021.101084.A combined forecasting system based on multi-objective optimization and feature extraction strategy for hourly PM2.5 concentration
[J]. Applied Soft Computing, 2022, 114: 108034. DOI: 10.1016/j.asoc.2021.108034.Short-term prediction of particulate matter (PM10 and PM2.5) in Seoul, South Korea using tree-based machine learning algorithms
[J]. Atmospheric Pollution Research, 2022, 13(10): 101547. DOI: 10.1016/j.apr.2022.101547.Predicting spatiotemporal variations of PM2.5 concentrations during spring festival for county-level cities in China using VIIRS-DNB data
[J]. Atmospheric Environment, 2023, 294: 119484. DOI: 10.1016/j.atmosenv.2022.119484.Multi-directional temporal convolutional artificial neural network for PM2.5 forecasting with missing values: A deep learning approach
[J]. Urban Climate, 2021, 36: 100800. DOI: 10.1016/j.uclim.2021.100800.Estimating urban PM2.5 concentration: An analysis on the nonlinear effects of explanatory variables based on gradient boosted regression tree
[J]. Urban Climate, 2022, 44: 101172. DOI: 10.1016/j.uclim.2022.101172.Hourly traffic flow forecasting using a new hybrid modelling method
[J]. Journal of Central South University, 2022, 29(4): 1389-1402. DOI: 10.1007/s11771-022-5000-2.A heterogeneous ensemble architecture coupling model selection sorting and residual error iterative correction for crude oil price forecasting
[J]. Applied Soft Computing, 2023, 148: 110865. DOI: 10.1016/j.asoc.2023.110865.Improving PM2.5 forecast during haze episodes over China based on a coupled 4D-LETKF and WRF-Chem system
[J]. Atmospheric Research, 2021, 249: 105366. DOI: 10.1016/j.atmosres.2020.105366.Evaluation of real-time PM2.5 forecasts with the WRF-CMAQ modeling system and weather-pattern-dependent bias-adjusted PM2.5 forecasts in Taiwan
[J]. Atmospheric Environment, 2021, 244: 117909. DOI: 10.1016/j.atmosenv.2020.117909.Wind speed forecasting using a new multi-factor fusion and multi-resolution ensemble model with real-time decomposition and adaptive error correction
[J]. Energy Conversion and Management, 2020, 217: 112995. DOI: 10.1016/j.enconman.2020.112995.A hybrid neural network model for marine dissolved oxygen concentrations time-series forecasting based on multi-factor analysis and a multi-model ensemble
[J]. Engineering, 2021, 7(12): 1751-1765. DOI: 10.1016/j.eng.2020.10.023.A novel ensemble reinforcement learning gated unit model for daily PM2.5 forecasting
[J]. Air Quality, Atmosphere & Health, 2021, 14(3): 443-453. DOI: 10.1007/s11869-020-00948-x.Forecasting of Beijing PM2.5 with a hybrid ARIMA model based on integrated AIC and improved GS fixed-order methods and seasonal decomposition
[J]. Heliyon, 2022, 8(12):A deep learning approach for prediction of air quality index in a metropolitan city
[J]. Sustainable Cities and Society, 2021, 67: 102720. DOI: 10.1016/j.scs.2021.102720.IoT based: Air quality index and traffic volume correlation
[C]//Short-term wind speed forecasting using deep reinforcement learning with improved multiple error correction approach
[J]. Energy, 2022, 239: 122128. DOI: 10.1016/j.energy.2021.122128.A hybrid neural network model for short-term wind speed forecasting based on decomposition, multi-learner ensemble, and adaptive multiple error corrections
[J]. Renewable Energy, 2021, 165: 573-594. DOI: 10.1016/j.renene.2020.11.002.An ensemble self-learning framework combined with dynamic model selection and divide-conquer strategies for carbon emissions trading price forecasting
[J]. Chaos, Solitons & Fractals, 2023, 173: 113692. DOI: 10.1016/j.chaos.2023.113692.Exploring Copula-based Bayesian model averaging with multiple ANNs for PM2.5 ensemble forecasts
[J]. Journal of Cleaner Production, 2020, 263: 121528. DOI: 10.1016/j.jclepro. 2020.121528.An enhanced hybrid ensemble deep learning approach for forecasting daily PM2.5
[J]. Journal of Central South University, 2022, 29(6): 2074-2083. DOI: 10.1007/s11771-022-5051-4.A hybrid decomposition-boosting model for short-term multi-step solar radiation forecasting with NARX neural network
[J]. Journal of Central South University, 2021, 28(2): 507-526. DOI: 10.1007/s11771-021-4618-9.Development of ANFIS models for air quality forecasting and input optimization for reducing the computational cost and time
[J]. Atmospheric Environment, 2016, 128: 246-262. DOI: 10.1016/j.atmosenv.2016.01.007.An LSTM-based aggregated model for air pollution forecasting
[J]. Atmospheric Pollution Research, 2020, 11(8): 1451-1463. DOI: 10.1016/j.apr.2020.05.015.Forecasting PM2.5 levels in Santiago de Chile using deep learning neural networks
[J]. Urban Climate, 2021, 38: 100906. DOI: 10. 1016/j.uclim.2021.100906.Predicting next hour fine particulate matter (PM2.5) in the Istanbul Metropolitan City using deep learning algorithms with time windowing strategy
[J]. Urban Climate, 2023, 48: 101418. DOI: 10.1016/j.uclim.2023.101418.A new ensemble spatio-temporal PM2.5 prediction method based on graph attention recursive networks and reinforcement learning
[J]. Chaos, Solitons & Fractals, 2022, 162: 112405. DOI: 10.1016/j.chaos.2022.112405.Quantifying uncertainty of marine water quality forecasts for environmental management using a dynamic multi-factor analysis and multi-resolution ensemble approach
[J]. Chemosphere, 2023, 331: 138831. DOI: 10.1016/j.chemosphere.2023.138831.A city-based PM2.5 forecasting framework using spatially attentive cluster-based graph neural network model
[J]. Journal of Cleaner Production, 2023, 405: 137036. DOI: 10.1016/j.jclepro.2023.137036.A hybrid model for spatiotemporal forecasting of PM2.5 based on graph convolutional neural network and long short-term memory
[J]. Science of the Total Environment, 2019, 664: 1-10. DOI: 10.1016/j.scitotenv.2019.01.333.Dynamic graph convolution neural network based on spatial-temporal correlation for air quality prediction
[J]. Ecological Informatics, 2022, 70: 101736. DOI: 10.1016/j.ecoinf. 2022.101736.An enhanced interval PM2.5 concentration forecasting model based on BEMD and MLPI with influencing factors
[J]. Atmospheric Environment, 2020, 223: 117200. DOI: 10. 1016/j.atmosenv.2019.117200.Linear and nonlinear framework for interval-valued PM2.5 concentration forecasting based on multi-factor interval division strategy and bivariate empirical mode decomposition
[J]. Expert Systems with Applications, 2022, 205: 117707. DOI: 10. 1016/j.eswa.2022.117707.Exploiting PSO-SVM and sample entropy in BEMD for the prediction of interval-valued time series and its application to daily PM2.5 concentration forecasting
[J]. Applied Intelligence, 2023, 53(7): 7599-7613. DOI: 10.1007/s10489-022-03835-3.A hybrid framework for forecasting PM2.5 concentrations using multi-step deterministic and probabilistic strategy
[J]. Air Quality, Atmosphere & Health, 2019, 12(7): 785-795. DOI: 10.1007/s11869-019-00695-8.Double decomposition and optimal combination ensemble learning approach for interval-valued AQI forecasting using streaming data
[J]. Environmental Science and Pollution Research, 2020, 27(30): 37802-37817. DOI: 10.1007/s113 56-020-09891-x.Comparison of performance of data imputation methods for numeric dataset
[J]. Applied Artificial Intelligence, 2019, 33(10): 913-933. DOI: 10.1080/08839514.2019.1637138.Nearest neighbor imputation algorithms: A critical evaluation
[J]. BMC Medical Informatics and Decision Making, 2016, 16(A data-driven graph generative model for temporal interaction networks
[C]//Disentangled spatiotemporal graph generative models
[J]. Proceedings of the AAAI Conference on Artificial Intelligence, 2022, 36(6): 6541-6549. DOI: 10.1609/aaai.v36i6.20607.Social behavior prediction with graph U-Net+
[J]. Discover Internet of Things, 2021, 1(1): 18. DOI: 10.1007/s43926-021-00018-3.A hybrid multi-resolution multi-objective ensemble model and its application for forecasting of daily PM2.5 concentrations
[J]. Information Sciences, 2020, 516: 266-292. DOI: 10.1016/j.ins.2019.12.054.A novel PM2.5 concentrations probability density prediction model combines the least absolute shrinkage and selection operator with quantile regression
[J]. Environmental Science and Pollution Research, 2022, 29(52): 78265-78291. DOI: 10.1007/s11356-022-21318-3.LI Yan-fei, YANG Rui, DUAN Zhu and LIU Hui declare that they have no conflict of interest.
LI Yan-fei, YANG Rui, DUAN Zhu, LIU Hui. PM2.5 probabilistic forecasting system based on graph generative network with graph U-nets architecture [J]. Journal of Central South University, 2025, 32(1): 304-318. DOI: https://doi.org/10.1007/s11771-025-5857-y.
李燕飞,杨睿,段铸等.基于图U-nets架构的图生成网络PM2.5概率预测系统[J].中南大学学报(英文版),2025,32(1):304-318.

