1 Introduction
According to the statistics from relevant literature, tool failures account for 7%-20% of the total downtime of machine tools [1]. It is necessary to establish a reliable and efficient tool condition monitoring system to accurately predict tool life [2].
Chip morphology is a crucial factor in predicting the wear state of a milling cutter. The wear of the cutter increases cutting pressure and heat between the cutter and the workpiece material, leading to a modification in chip morphology, which in turn affects the surface quality after machining. CHEN et al [3] modelled the geometry of the chip, the time coefficient of the coupling effect relative to the chip segments, the temperature rise of different heat sources, and the thermal convection of the chip segmentation process. They proposed a new method to measure the heat distribution in the shear zone and its changes during chip generation. CHEN et al [4] proposed a geometrical model of a serrated chip segment for metal cutting based on chip formation and cutting force for high-speed milling process, and investigated the chip geometry, shear band angle, secondary shear angle, third shear angle, strain and its rate and its evolution law in the chip formation process. The texture pattern of the tool marks on the machined surface of the workpiece implies information about the wear of the milling cutter. ZHANG et al [5] investigated the effect of tool wear position and angle on workpiece surface roughness. They established a simulation model of workpiece surface topography including the tool wear factor. The study identified a significant correlation between tool wear and the machined surface topography. WOJCIECHOWSKI et al [6] investigated the ploughing phenomena occurring during milling of ALSI L6 alloy steel. They investigated the effects of different wear levels and machining postures of ball end milling cutters on the strength of plowing phenomenon, further demonstrating the correlation between cutter texture and machining conditions. WOJCIECHOWSKI et al [7] analyzed the stress and process efficiency of the fine milling process for 55NiCrMoV6 hardened steel. They summarized the impact of parameters such as ball-end milling cutter cutting speed and surface inclination angle on cutting force. The authors proposed a method for reducing milling force and improving processing efficiency.
In recent years, research on the formation mechanism of machined surface texture has become more in-depth. Moreover, the method of predicting tool wear status through tool mark surface texture has made significant progress, and this method makes it easy to measure milling cutter wear during off-machine inspection of the part [8]. DUTTA et al [9] used the gray co-occurrence matrix to describe the surface texture image after turning, investigated the relationship between the descriptor and the amount of wear, and realized the state monitoring of the turning tool. DUTTA et al [10] investigated the changing law of milling cutter wear texture features when two texture description methods, grey level co-occurrence matrix and run length statistics, were used for machined surface images, and verified the connection between cutter mark texture and milling cutter wear from the perspective of image distribution statistics. DUTTA et al [11] analyzed the surface image of the workpiece processed by the end mill; they extracted features highly correlated with progressive tool wear and constructed a support vector machine model to achieve tool wear prediction with a correlation of 94.8%. WONG et al [12] proposed the Dis-ANN modular neural network, which took the machined surface image features extracted from the texture descriptor and the sound signal as input to realize tool wear prediction. PENG et al [13] employed the machine vision method to directly measure the wear area of the flank, conducted the orthogonal experiment to study the change law of the tool wear under different processing parameters, and utilized the gray level co-occurrence matrix to analyze the surface texture change, achieving indirect characterization of tool wear from the perspective of surface texture. LI et al [14] designed a tool condition monitoring method by comparing a standard sample block of Invar alloy with the cutting surface using focus variation scanning technique (FVST), and they quantified the tool wear condition by building a model for evaluating the characteristic parameters.
The recent work mentioned above shows that there are more mature research results on the formation mechanism of surface texture of milling cutter marks. Many studies have been carried out to analyze the effects of tool wear, tool attitude, machining conditions and other factors on the cutter mark texture. However, there are still some gaps in the research on the utilization of cutter mark texture to predict tool wear as follows:
1) Most of the existing prediction methods are macroscopic evaluations of the machined tool mark surface, lacking targeted extraction of tool wear-related features, and the prediction results are easily affected by factors such as image light and shadow distribution and machining conditions.
2) Statistical-based image texture feature extraction algorithms or deep learning-based texture recognition algorithms are insensitive to the gradient of fine features in the image, while the effect of different image light and dark distributions on the feature values needs to be avoided during feature extraction.
3) The situation is more complicated when using cutter mark texture to predict milling cutters with spatially curved edge lines, and the existing research only focuses on the flat surface after machining of flat-bottomed end milling cutters, which needs to be further generalized to multiple types of milling cutters.
The rest of this paper is organized as follows. In Section 2, the process of preparing the data samples of tool mark images through wear experiments in this paper is introduced. In Section 3, the change rule of the tool mark image with the tool wear state in the experimental data sample is analyzed. A two-dimensional sample entropy method is established to quantify the image texture regularity and compensate the wear prediction process by using machining parameters. In Section 4, the texture description algorithm proposed in this paper is tested and the accuracy of the tool condition prediction method is analyzed. Finally, the obtained results are summarized in Section 5.
2 Experimental procedures
In this paper, the sample data corresponding to different wear degrees, wear positions, and processing mark texture images of the tool were prepared by conducting the milling wear experiment of the ball end milling cutter. As illustrated in Figure 1, the experiment was conducted on a VDL-1000E three-axis CNC milling machine. The tools used in the experiment were two R5 two-edged tungsten carbide ball-end milling cutters with TiAlN coating, the helix angle was 45°, and the hardness was HRC 65. The sizes of the workpiece are 190 mm×185 mm×100 mm, the material is Cr12MoV, and the hardness reaches HRC 58 after heat treatment. Additionally, a 30° bevel as shown in Figures 1(b) and (c) was processed on the top of the workpiece in advance to obtain the required inclination angle for ball end milling.

To avoid the influence of the thermal-mechanical coupling effect on the tool wear law during the wear process while ensuring the progressive nature of the wear process in the sample data, the continuous processing scheme with the same milling cutter was used in this experiment, and the sampling interval of wear amount and processed surface texture image was set to 22.5 min. To retain the texture of tool marks during machining, two workpieces were set up for tool wear and tool marks respectively in the experiment. Before the start of the experiment, the surface machining of the workpiece used to retain the tool marks is shown in Figure 1(c), and the excess material was removed to ensure that the cutting amount of the two workpieces was the same. The specific experimental steps are described below:
1) Use the parameter settings listed in Table 1 to consume tool life on the inclined surface of the workpiece used for tool wear in Figure 1(b), each continuous milling is 45 m, and the process takes about 22.5 min.
| Condition | Speed/ (r·min-1) | Feed/ (mm·min-1) | ap/mm | ae/mm |
|---|---|---|---|---|
| Wear process | 4000 | 2000 | 0.5 | 0.5 |
| Tool mark retention | 4000 | 800 | 0.5 | 0.5 |
2) Remove the tool together with the handle, and use the calibrated industrial camera in
Figure 1(d) to measure the flank wear width of the ball cutter, which is taken as the wear standard value in the sample data.
3) Reinstall the tool handle, and use the parameter settings listed in Table 1 to mill once on the workpiece used to retain the tool marks, leaving the machining tool marks in the current wear state of the tool. Meanwhile, the vibration signals during feeding are recorded.
4) Repeat the above steps until the maximum wear width VBmax of the tool flank reaches
0.3 mm, and then the tool wear experiment is finished.
To ensure the consistency of the tool wear process during the experiment, the wear process was repeated twice using the same parameter settings. After the milling session, the PZ-ZC3500A ultra depth of field microscope was used to collect the image of the tool mark surface as a data sample. The experimental method retained the tool mark texture in the wear state of the ball end milling cutter, and obtained corresponding data of the ball tool surface and workpiece tool marks at 7 time points throughout the life cycle of two sets of ball-end milling cutters. Through continuous sampling on the tool mark surface using a ultra depth of field microscope, more than 500 sets of valid data samples were obtained, including the milling tool wear location, milling tool wear degree, and workpiece tool mark texture appearance.
3 Methodology
3.1 Analysis of the correlation between tool wear and texture images
To characterize the position and degree of tool wear more accurately by using the tool mark texture, this paper first analyzes the potential correlation between the tool wear amount and the tool mark texture.
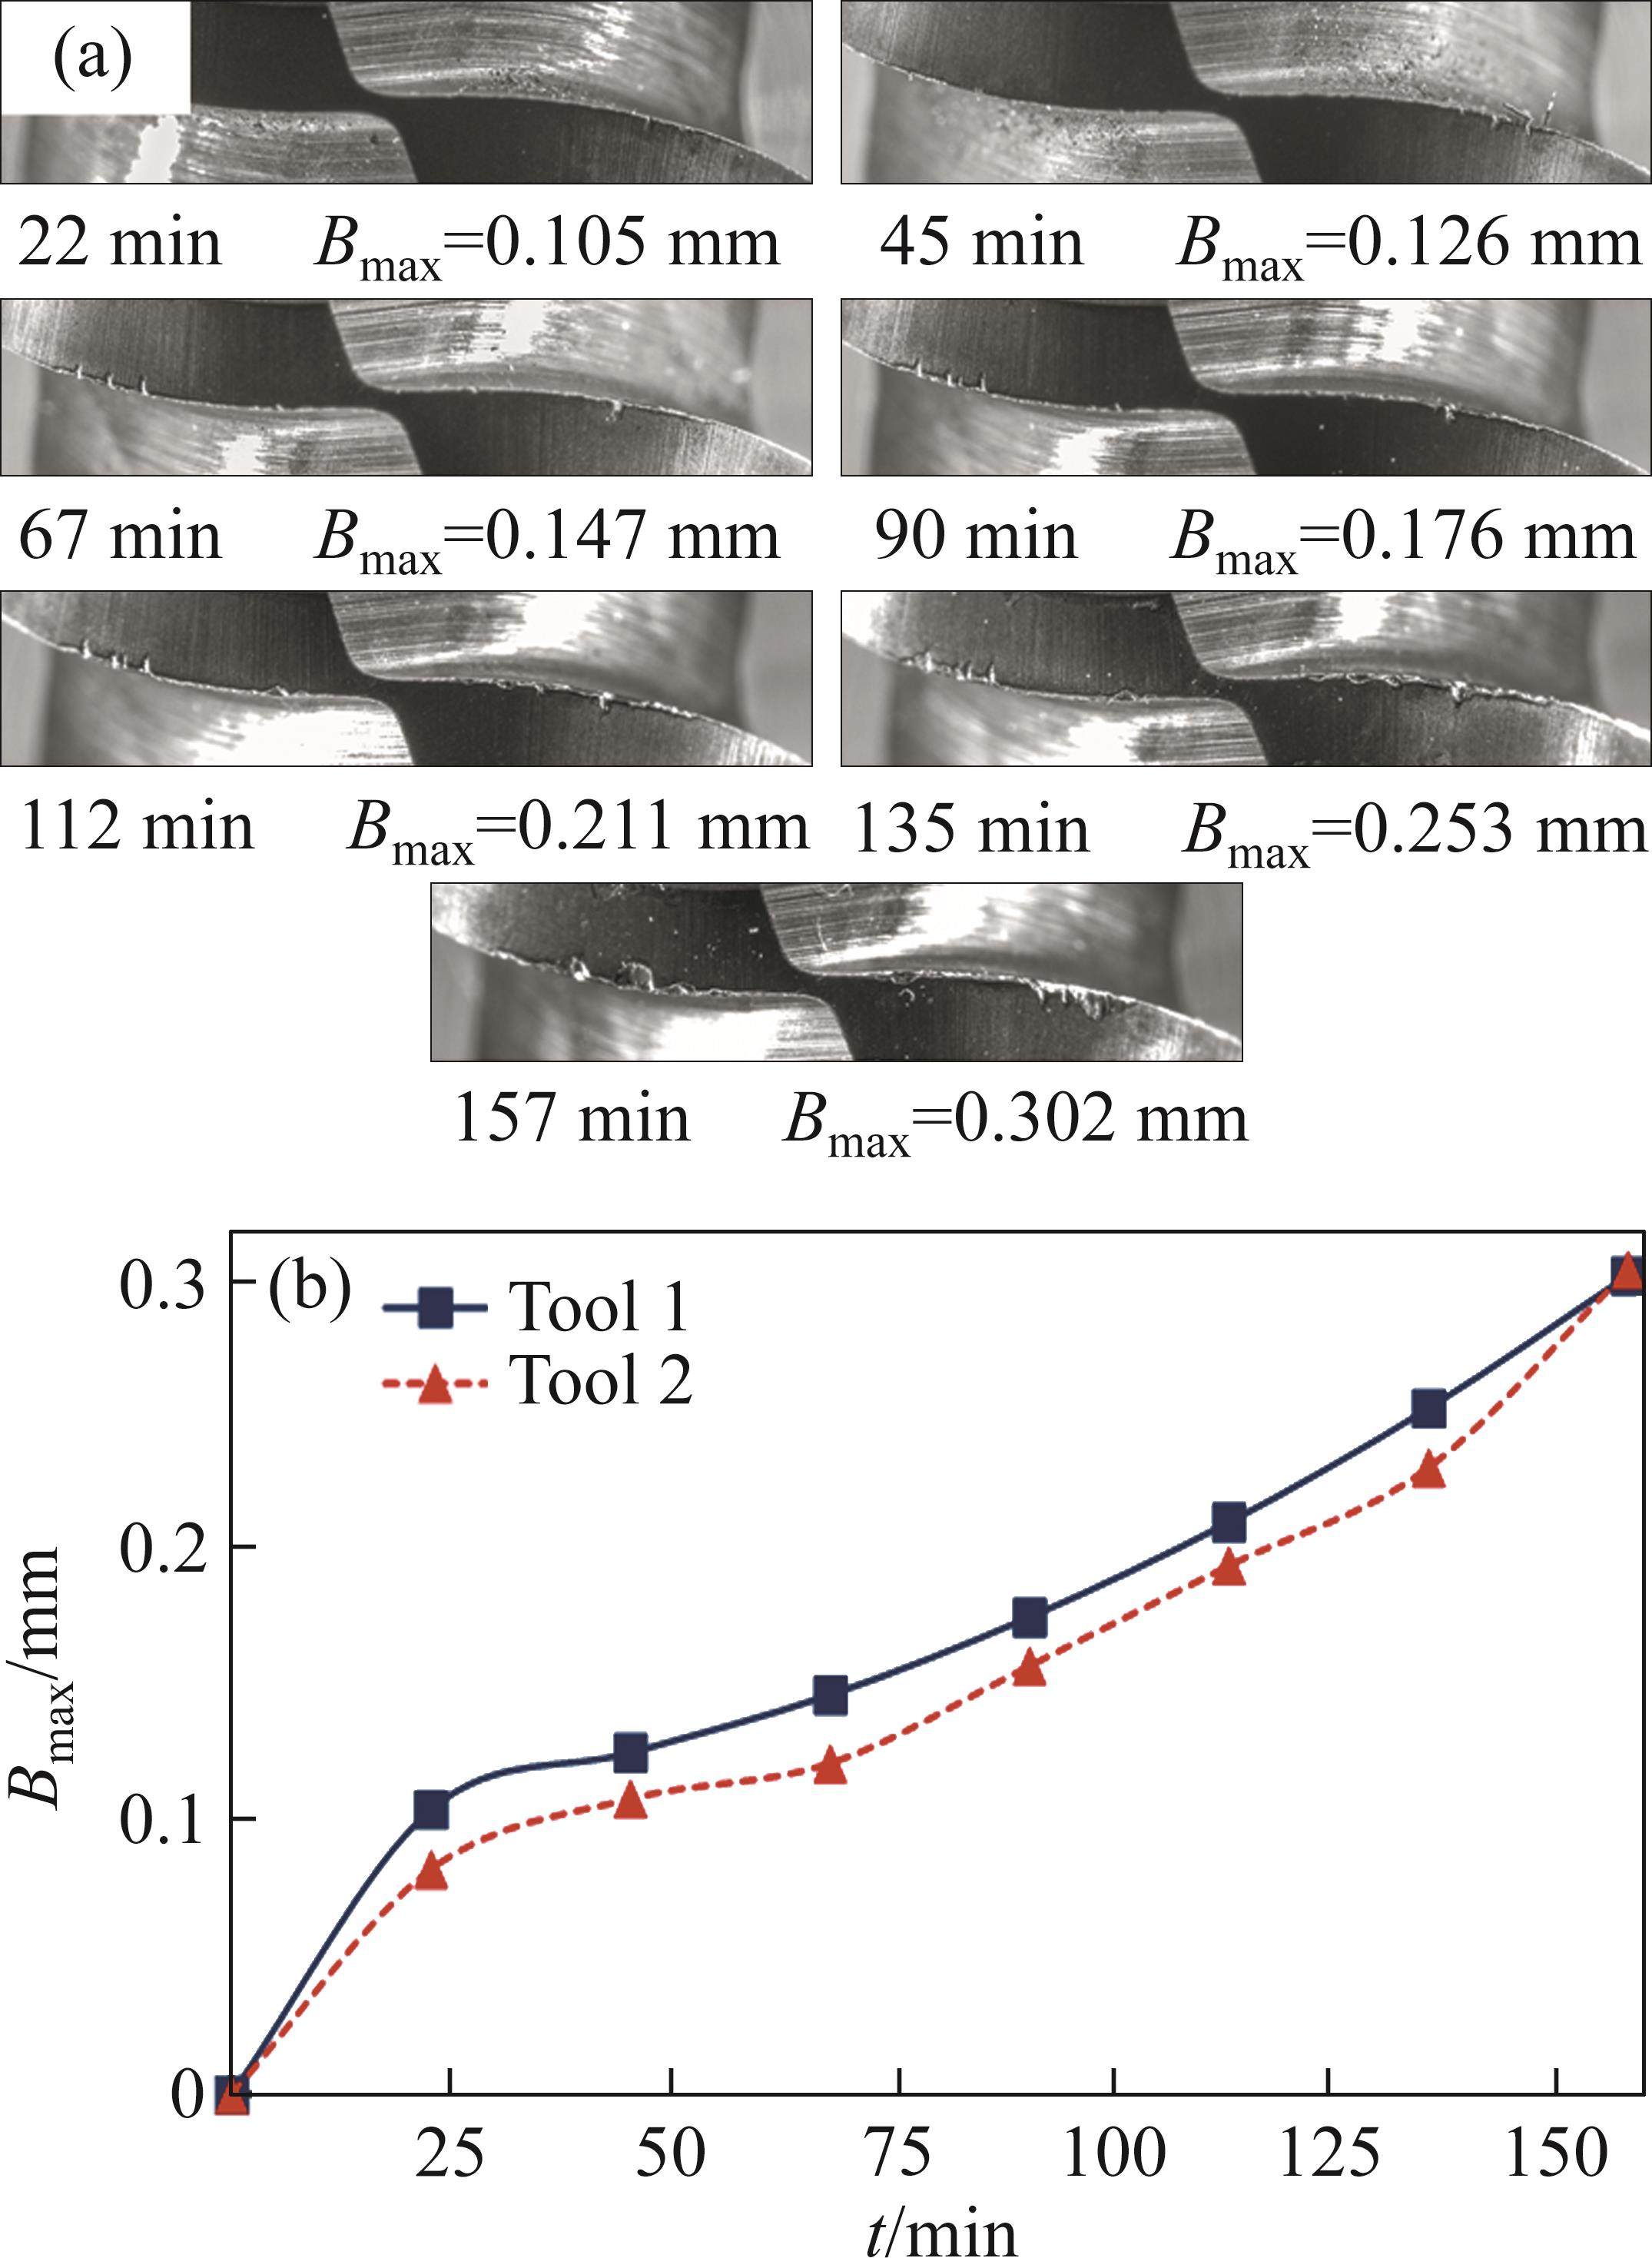
Figure 2(a) shows the wear morphology of the flank of the ball end milling cutter during the experiment. The experimental working condition was dry hard cutting. The milling cutter wore the TiAlN coating at the initial stage, and the front and flank coatings at the contact position of the ball edge line had been worn out at 22 min. In the following 20 min, the tool substrate was worn gradually. When the cumulative machining time of the tool reached 45 min, microchipping occurred at multiple points on the flank. Then, the milling cutter entered the slow-wear stage. Under the action of thermomechanical coupling in the milling process, microchipping and progressive wear gradually developed 135 min later, and the tool substrate material peeled off. At 157 min, the flank wear width exceeded 0.3 mm and met wear standards. In the experiment, the wear laws of the two cutting tools were consistent, and the influence of accidental factors was excluded. The wear curves are presented in Figure 2(b).
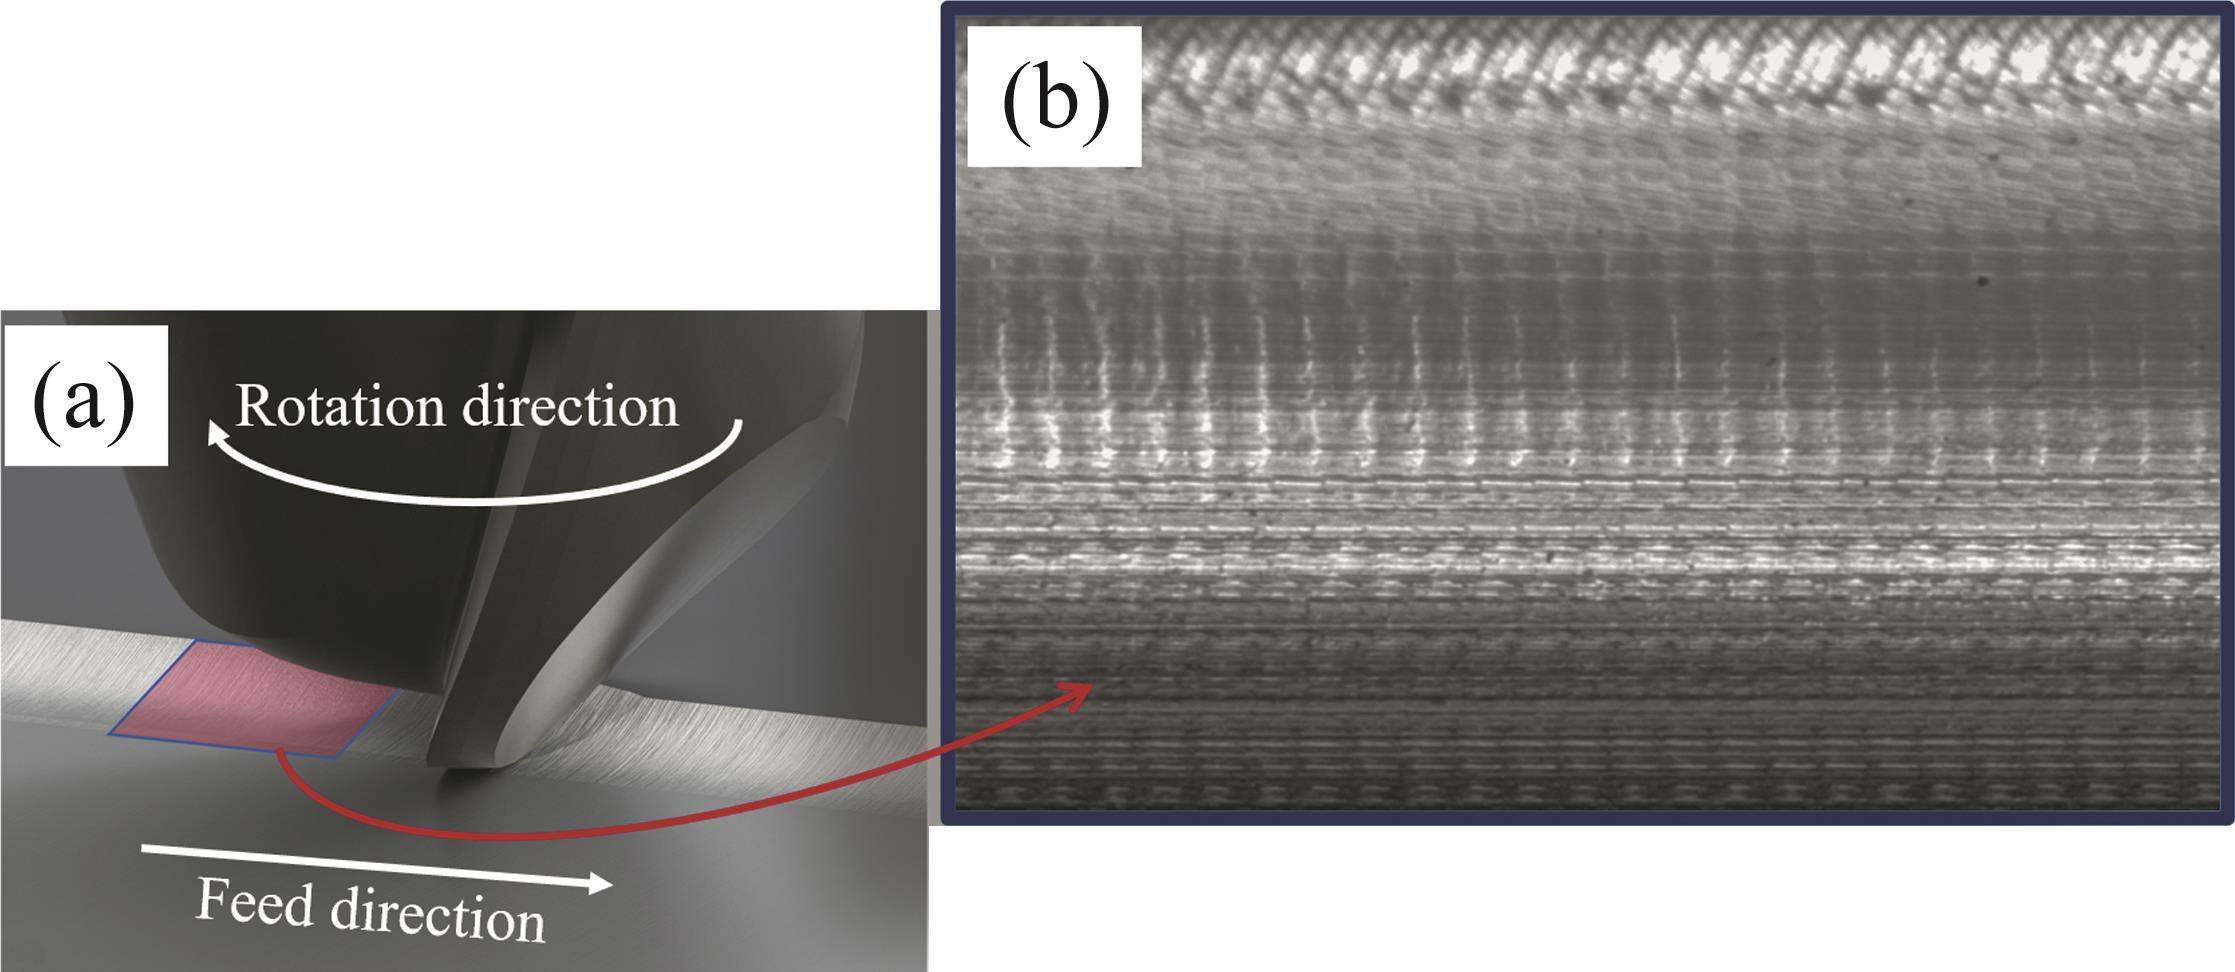
The texture position concerned in this paper is the swept surface of the tool tooth, as shown in Figure 3(a). The surface texture image of the position after the milling cutter passed is shown in Figure 3(b). The textures in the figure can be divided into two categories: longitudinal textures perpendicular to the feed direction, and transverse textures parallel to the feed direction. The longitudinal texture was produced by the feed motion of the ball cutter. After each sweep of the cutter teeth, a spherical cut surface matching the edge line of the cutter teeth was left on the surface. During the continuous feed motion of the cutter material removal, the cutter teeth of the ball cutter were constantly swept. Meanwhile, the change of load and the residual material between the two spherical cut surfaces in this process generated feed texture perpendicular to the direction of the tool on the surface of the tool mark. Besides, the transverse texture was generated by each sweep of the tool tooth, and when the shearing action occurred between the cutting edge of the tool and the material, the grinding action between the flank and the workpiece caused the workpiece material to be pulled along the sweeping direction of the cutter teeth, resulting in a transverse texture on the surface of the tool mark.
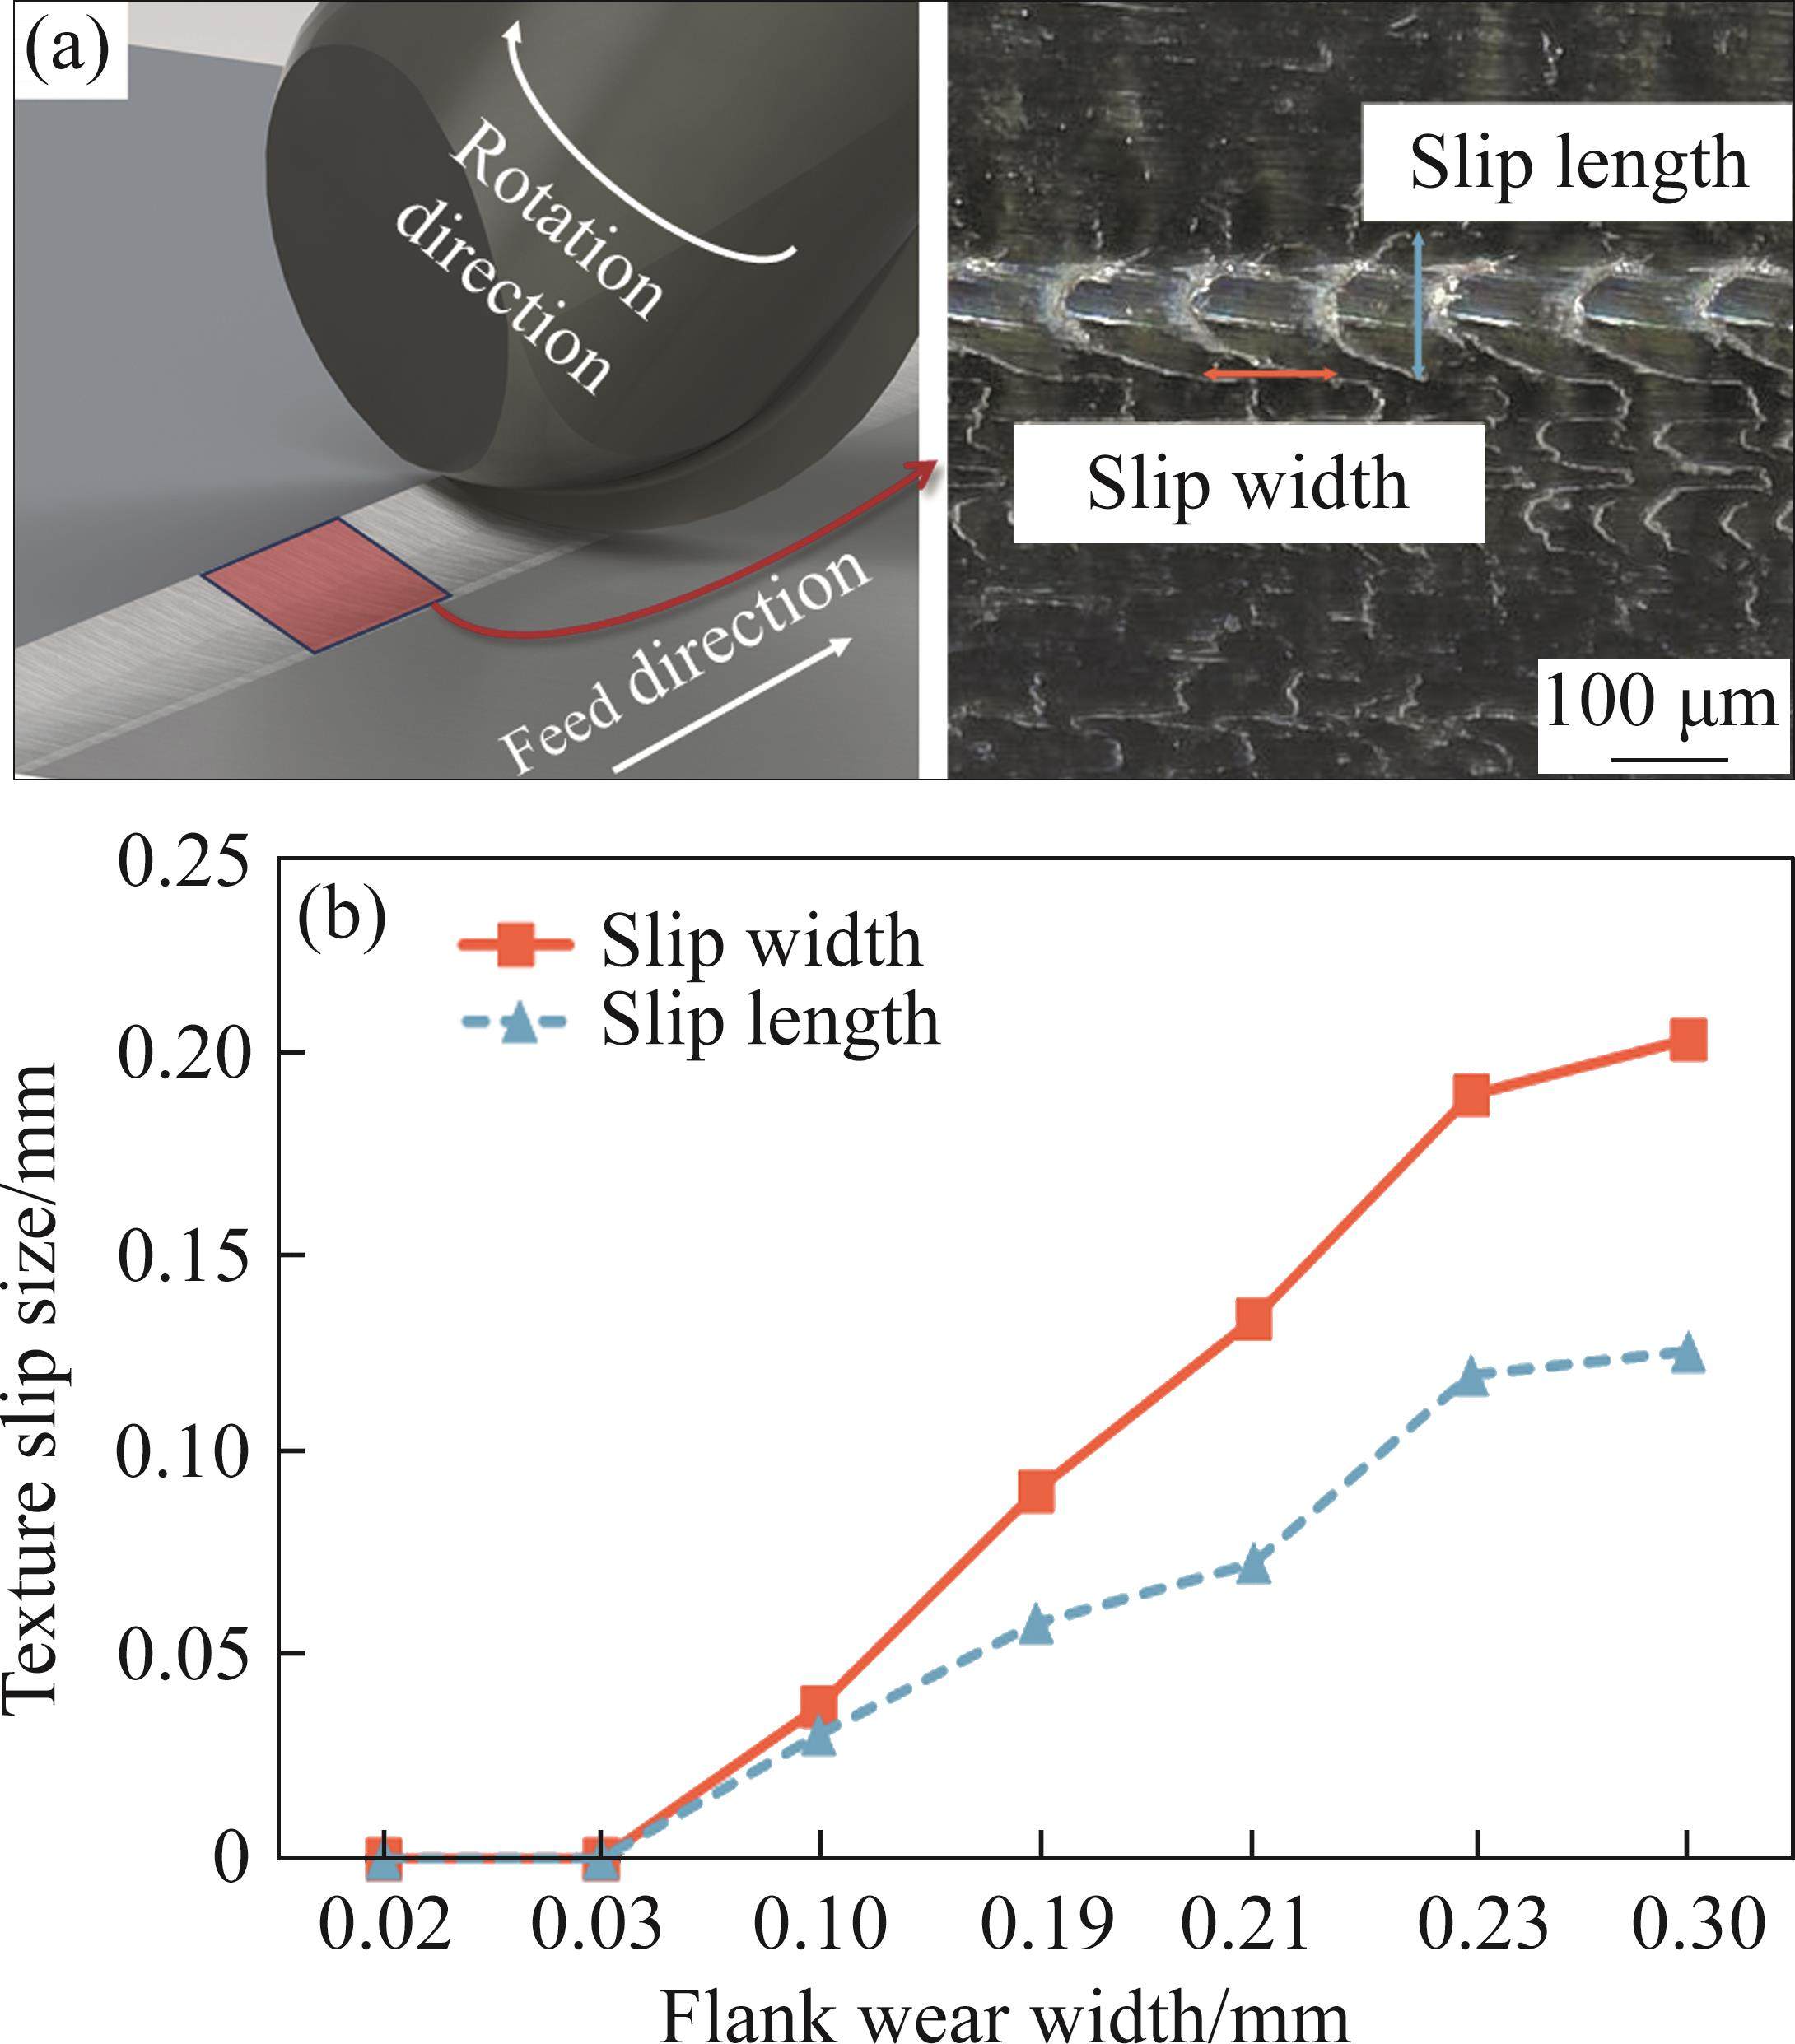
As the degree of tool wear continued to increase, the grinding effect between the cutting contact and the workpiece at the flank wear of the ball cutter also continued to increase; the transverse texture at the corresponding position of the tool mark image was prominent, and the longitudinal texture exhibited a tendency to slip in the direction of the tooth sweep.
The quantification of the texture slipping trend with the slip width and slip length is shown in Figure 4(a). Taking wear at 1.5-2 mm from the tool tip in the flank image of a ball cutter as an example, the width and length of the longitudinal texture slip increased with the wear amount, and the correlations between the two parameters and the wear amount reached 96.51% and 96.95%, respectively.
In the two sets of sample data obtained in the experiment, the wear points were selected from the contact areas where the cutting speed Vc of the tool edge line was 19000, 37000 and 53000 mm/min, respectively. Taking the slip width with a higher correlation as the quantification standard of the degree of texture slip, the change curve of the degree of texture slip with the wear amount is plotted in Figure 5(a). It can be seen that as the cutting speed increased, the influence of the same amount of wear on the texture of tool marks gradually decreased.
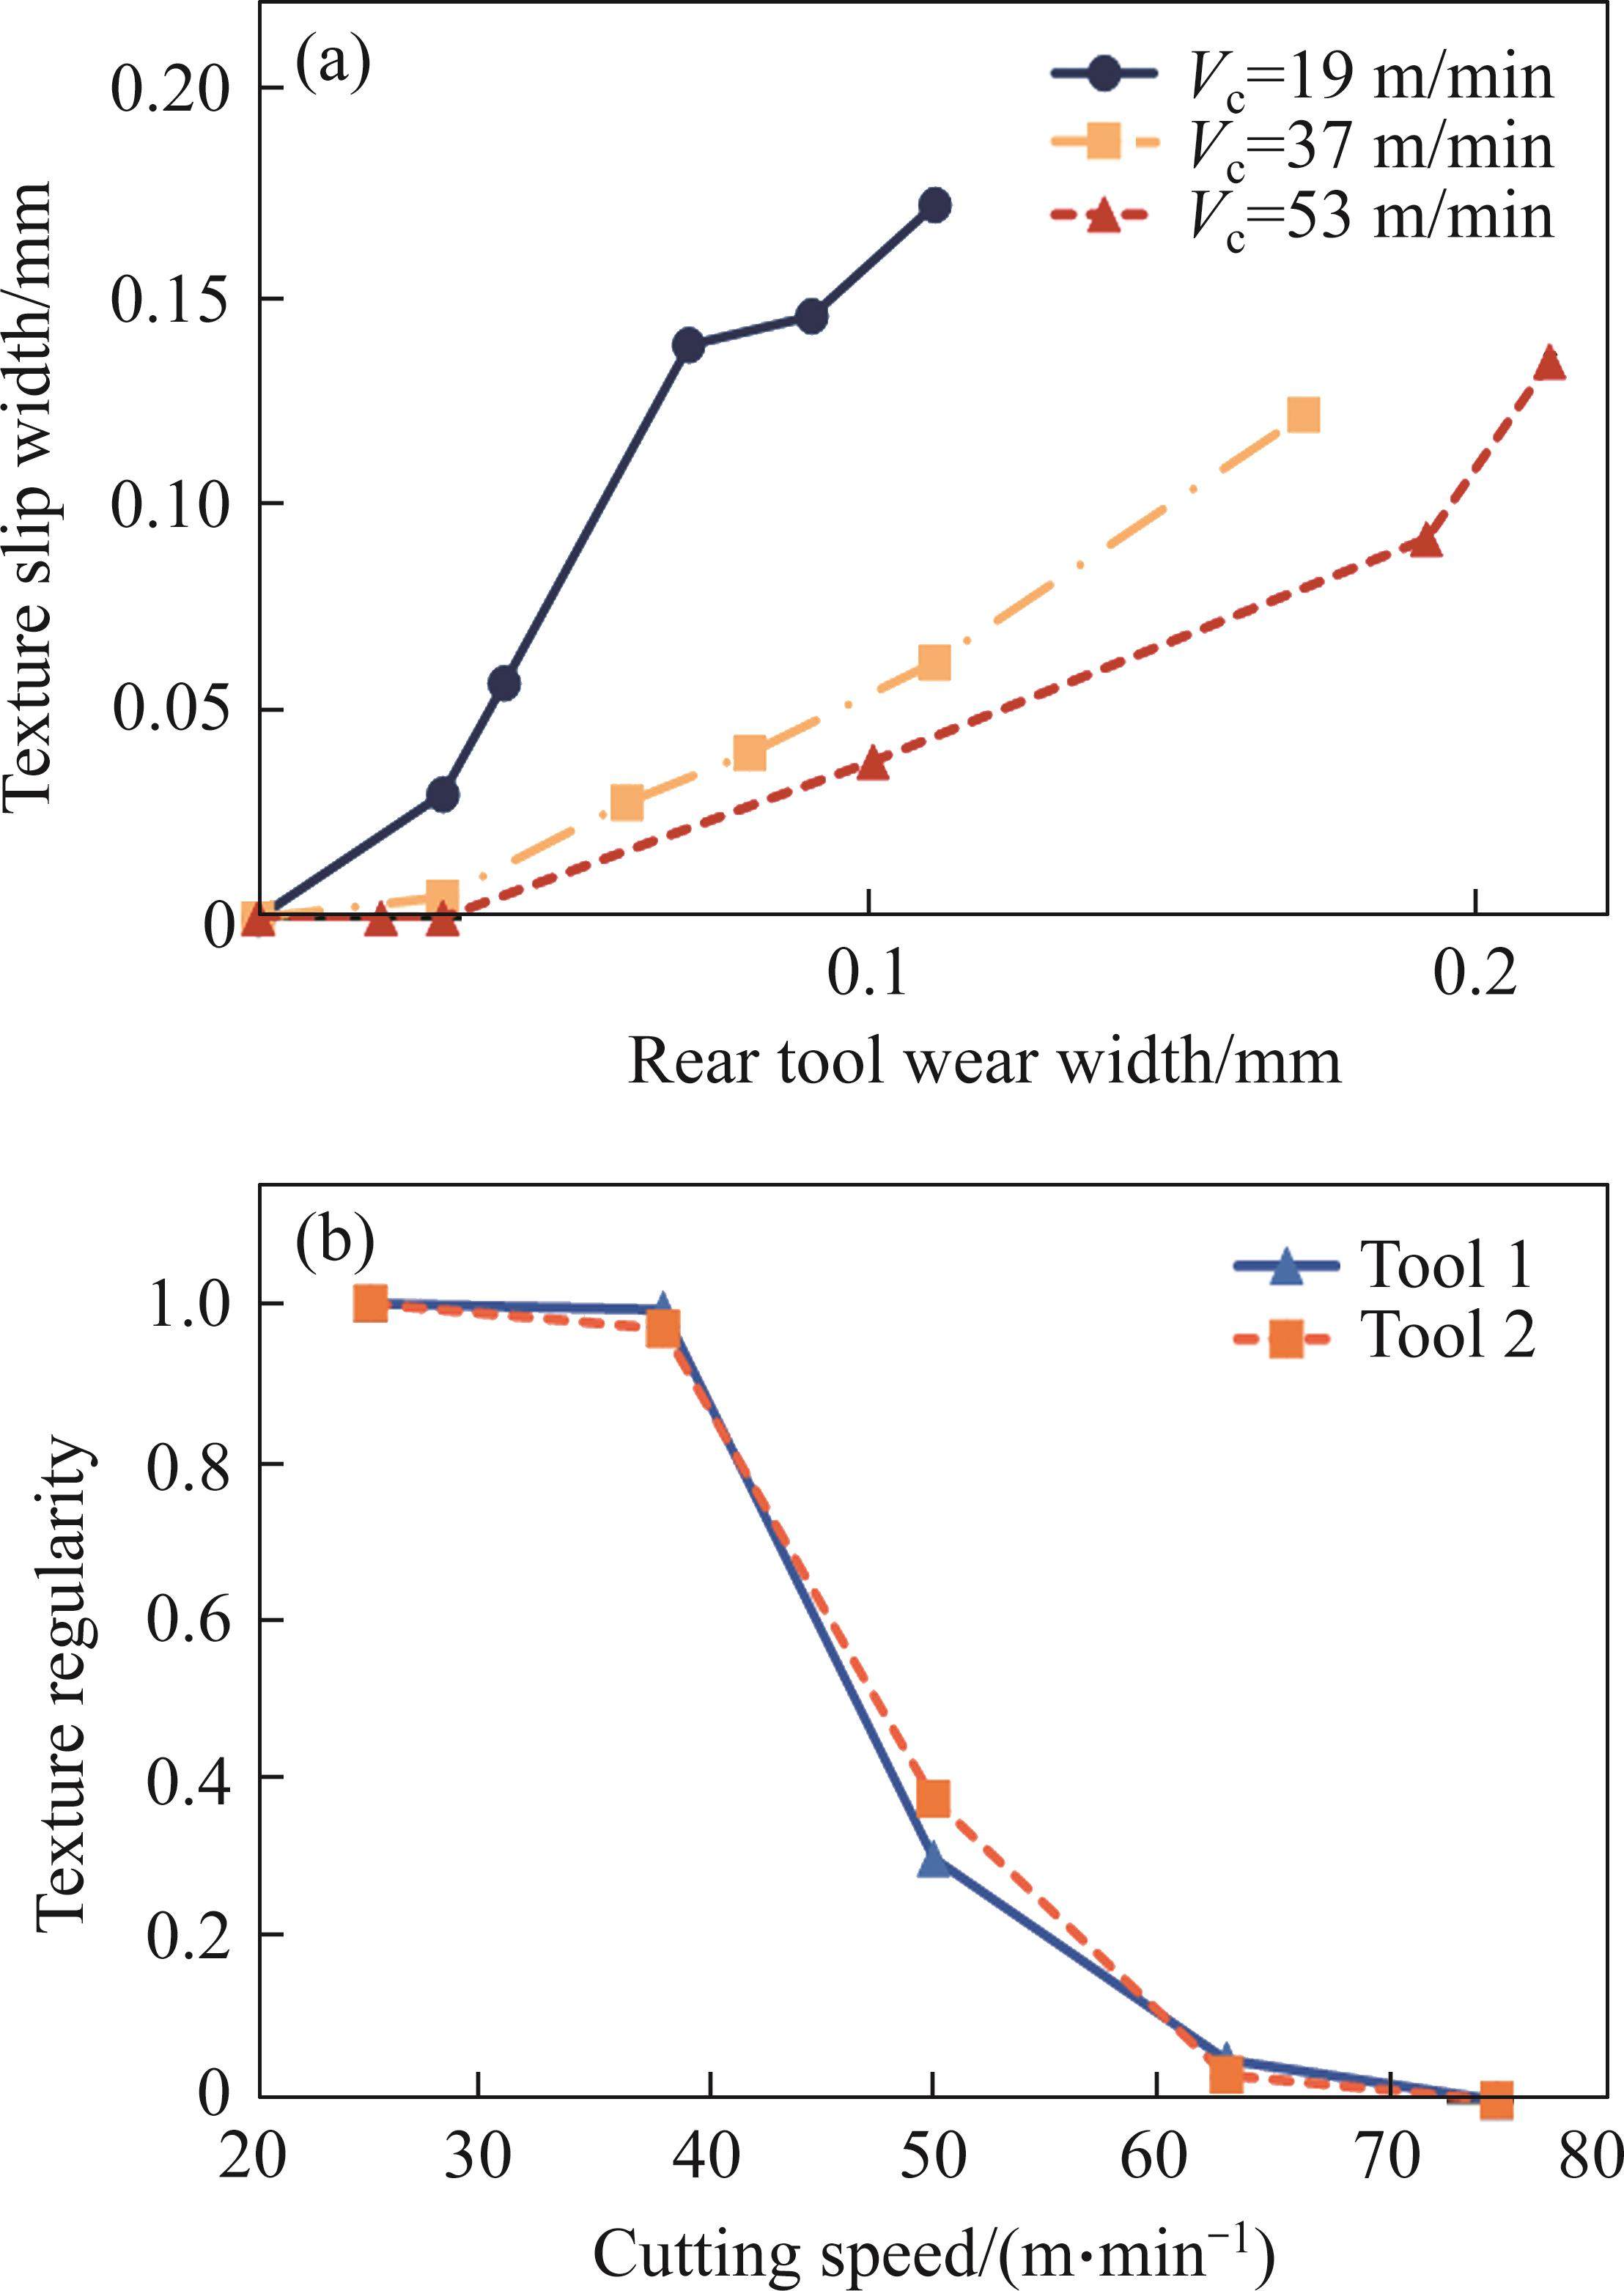
To further investigate the potential relationship between the cutting speed and the wear characteristics of tool mark texture, the data of similar wear amounts appearing in different cutting speed regions were searched from the two sets of wear data samples. As illustrated in Figure 5(b), when the flank wear was about 0.12 mm, the degree of texture irregularity showed an exponential relationship with the increase in cutting speed. Therefore, considering the cutting speed of the cutting point when predicting the amount of tool wear is of great significance to the accuracy of the results.
3.2 SampEn2D-based regularity quantization of tool mark texture image
According to the analysis in Section 3.1, the degree of longitudinal texture slippage of the tool mark image has an obvious correlation with the amount of tool wear. Thus, the quantitative description of the degree of texture regularity at the image level is conducive to the accurate prediction of tool wear.
The entropy-based image description method is an extension of the entropy measurement concept in the information field. In the literatures [15-18], the concepts of sample entropy, distribution entropy, and multi-scale entropy in one-dimensional signals are respectively introduced into the texture analysis method of two-dimensional images.
In this paper, combined with the morphological characteristics of tool mark texture changes analyzed in Section 3.1, a targeted texture description algorithm is proposed based on the concept of two-dimensional sample entropy. For an image u(i, j) with a width of W pixels and a height of H pixels, let Wm(i0, j0) be a square window with u(i0, j0) as the center and a width of m pixels. Then, the pixel coordinate range of the window sliding in the image of the target area can be represented as:

The sliding step of the window in the target image is set to S to reduce the running time of the algorithm in the large-scale image area. In this case, the total number of windows Nw that can be accommodated in the target image is expressed as:

For each window Wm(i0, j0) in the image area, the total number of similar windows N
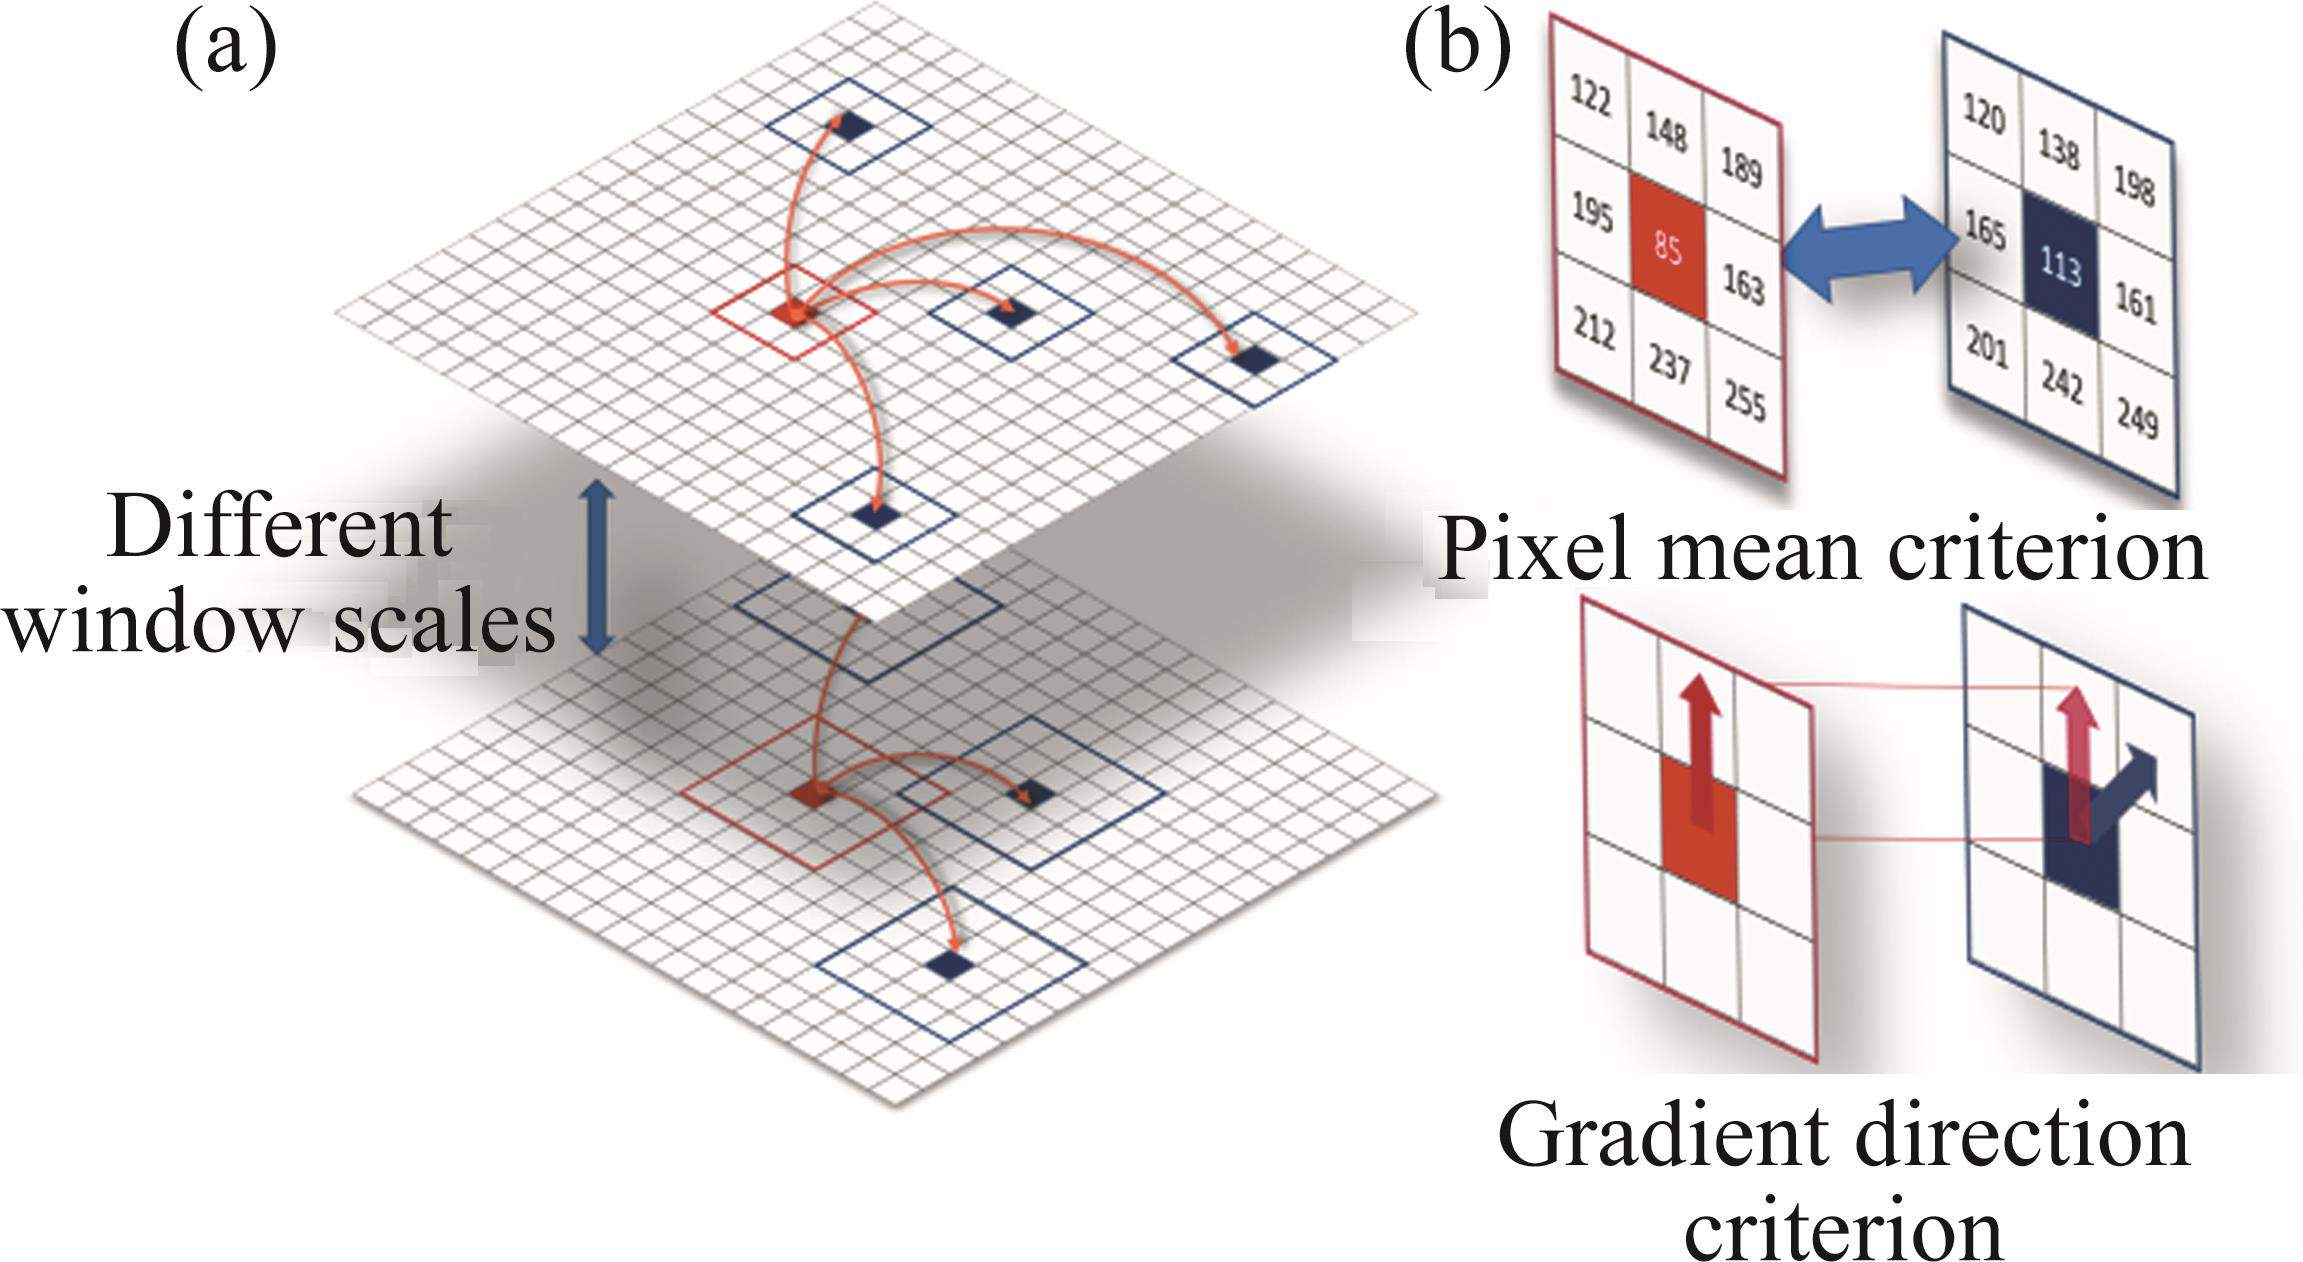
Eight directions at an interval of 45° are set around the central pixel of the window, and the angle threshold β is set as the similarity criterion of the gradient direction. Thus, the approximate ratio 

where Nm represents the number of windows that meets the conditions as:

On a window scale of m, the approximate ratio 
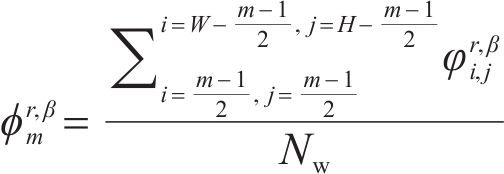
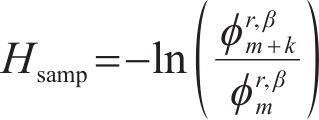
Then, the window scale is expanded to m+k, and the above-mentioned process is repeated. The eigenvalue of SampEn2D Hsamp of the image established in this paper is expressed as:
3.3 Wear mapping method based on texture extraction features
The influence of cutting speed on the shape of wear texture has been introduced in Section 3.1. However, in the milling process of the ball end milling cutter, the cutting speed of a certain area in the tool mark texture image is jointly determined by factors such as tool parameters, cutting contact position, tool attitude, and processing parameters.
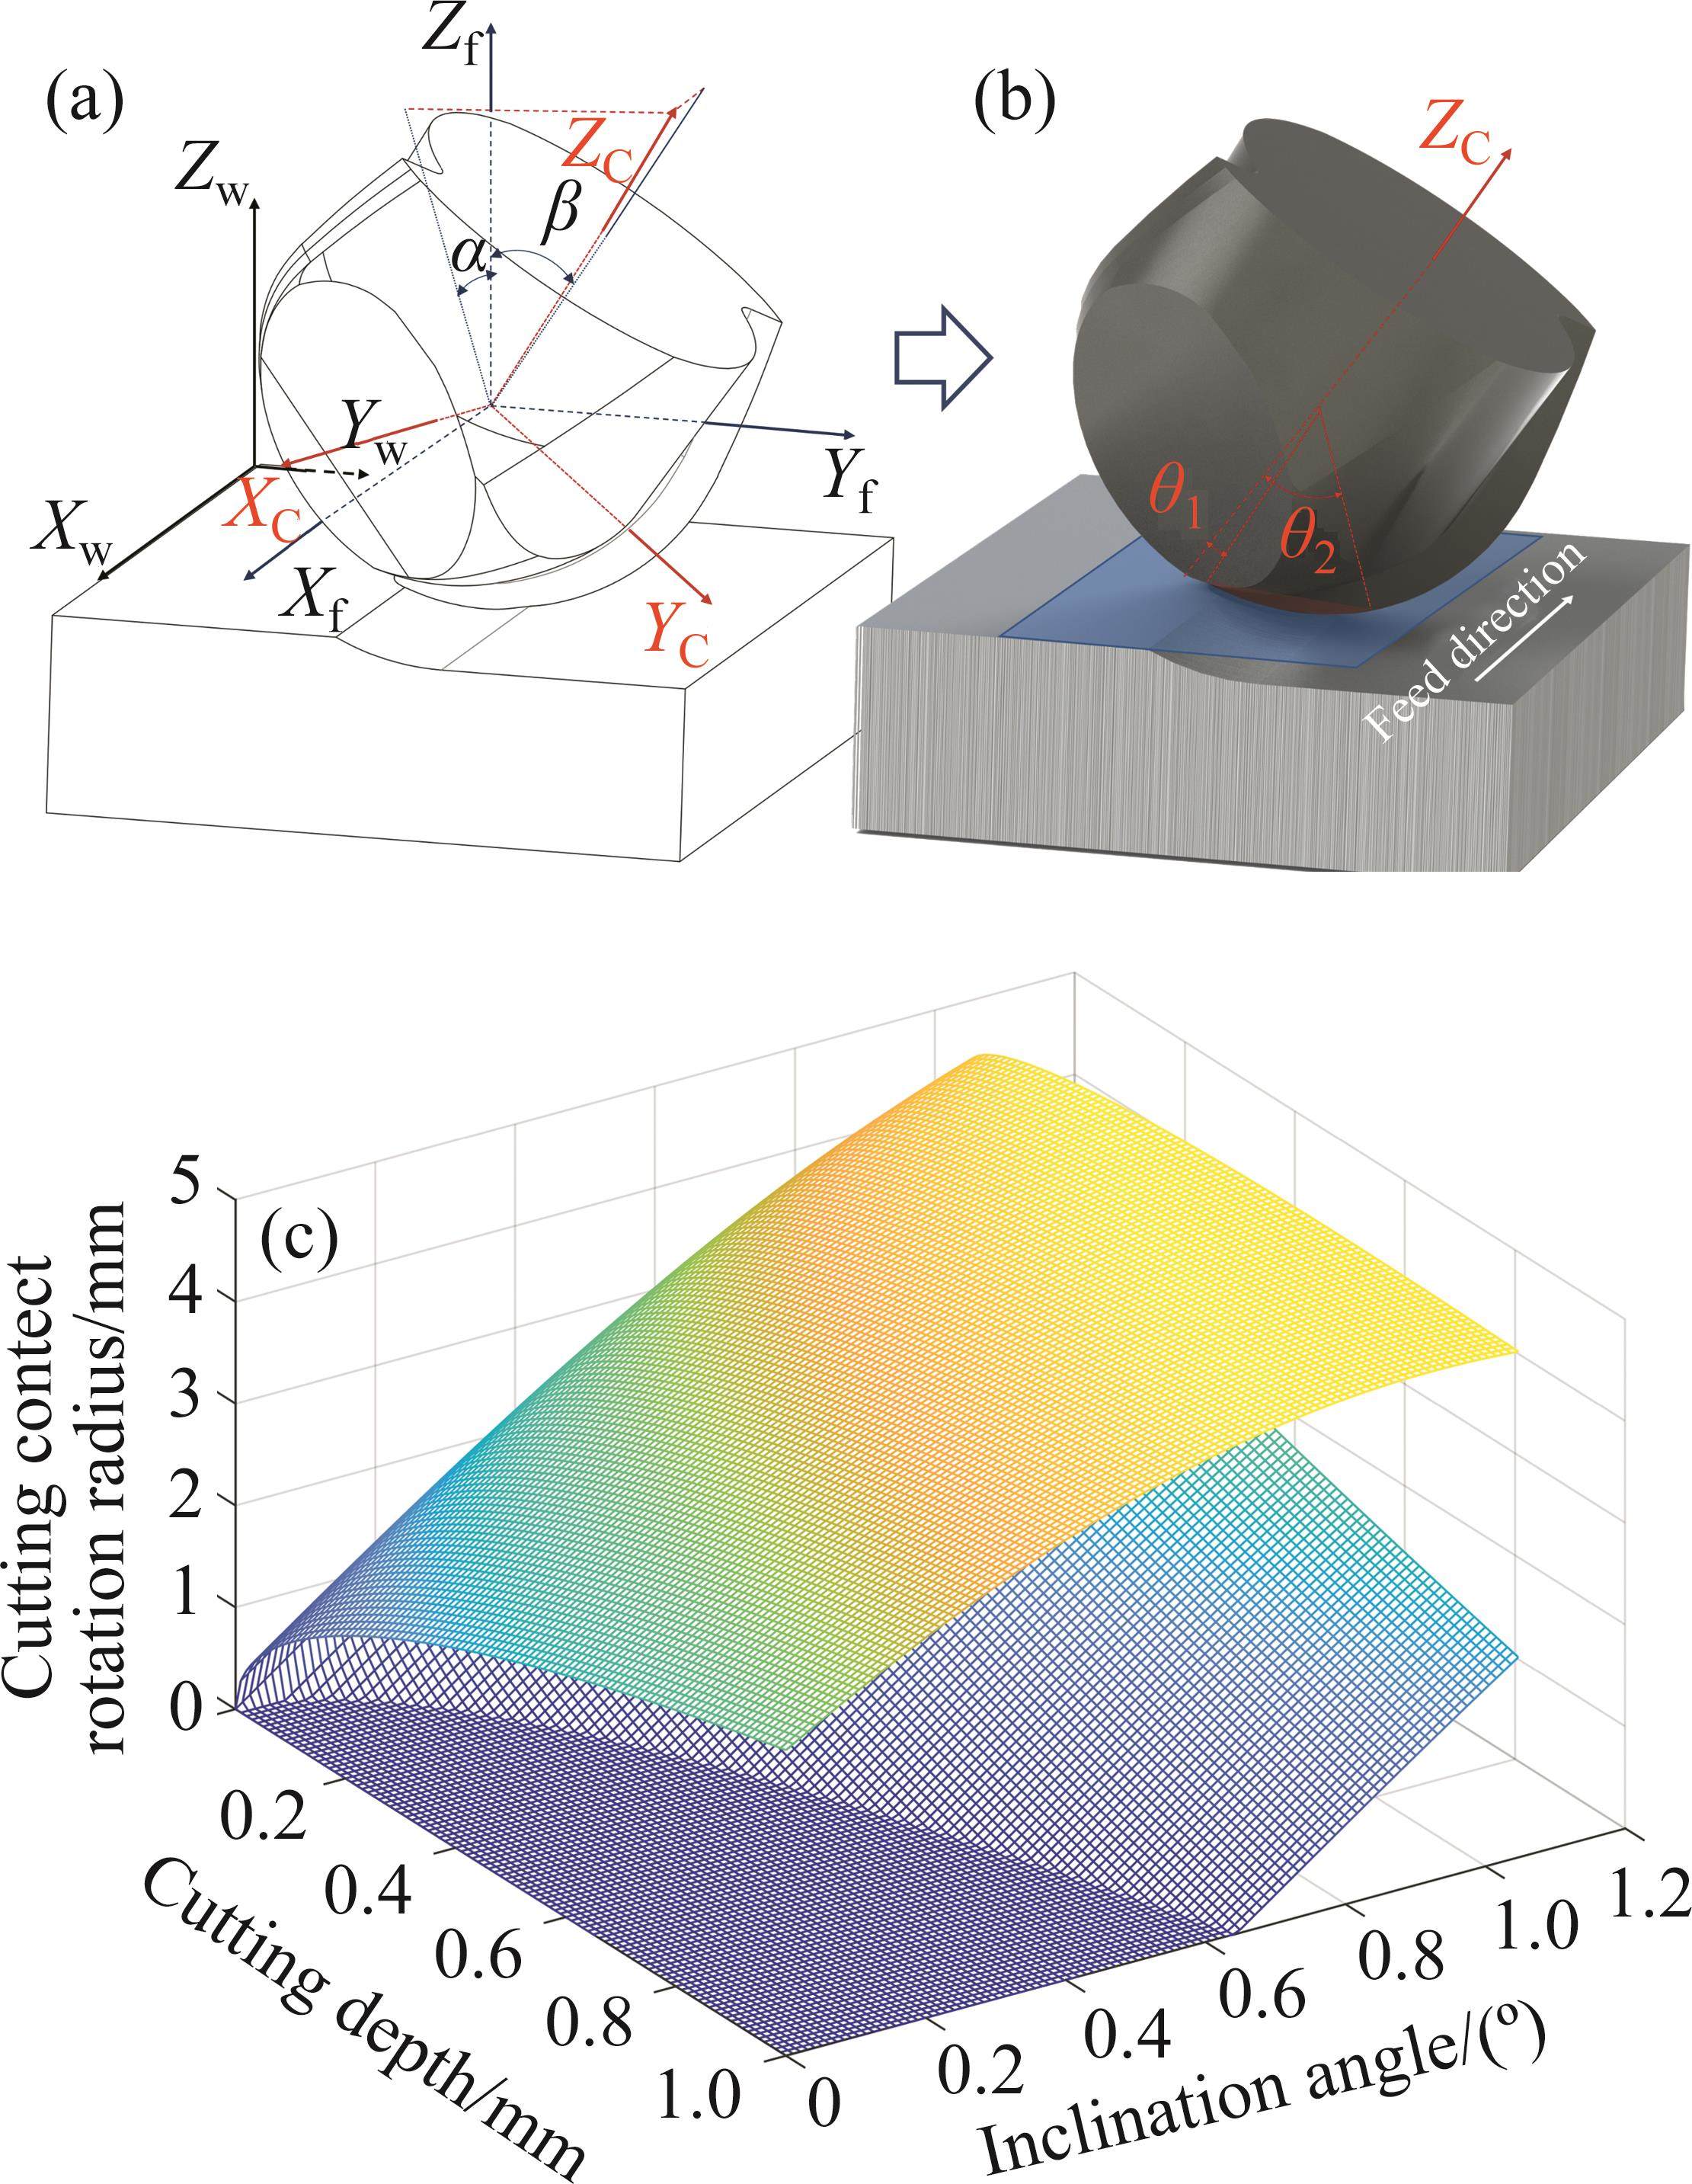
Firstly, the positional relationship between the ball cutter edge line and the workpiece surface is established. For rotary cutters, the rotation angle of the cutter has no influence to the machined surface from the theoretically geometric view [21]. Therefore, the models in this section do not consider the rotary motion of the tool. In the scene shown in Figure 7(a), the milling cutter edge line coordinate system {C}, the feed coordinate system{F}, and the workpiece coordinate system {W} are established respectively. The equation of the edge line on one side of the milling cutter can be expressed in formula (6).
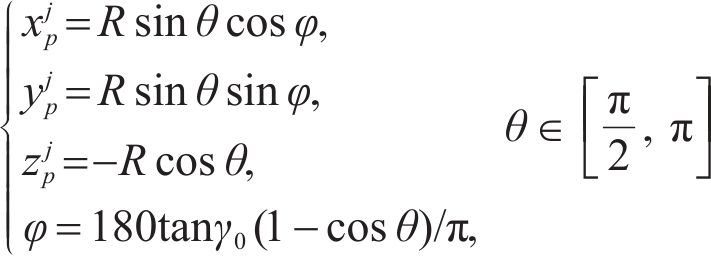
where R denotes the radius of the ball end milling cutter; θ denotes the axial position angle of a point on the edge line; φ denotes the helix lag angle of a point on the edge line; γ0 denotes the helix angle of the edge line of the ball end milling cutter.
The contact relationship between the ball end milling cutter and the workpiece is presented in Figure 7(a). α and β denote the forward inclination angle and side inclination angle of the ball cutter respectively, and the attitude inclination angle between the tool and the workpiece surface γ can be expressed as:

Then, the transformation matrix from the tool feed coordinate system {F} to the edge line coordinate system {C} can be expressed as:

where 
Here, this paper only considers the static state at a certain moment during the milling cutter machining process. Let (x0, y0) be the current tool machining position, 
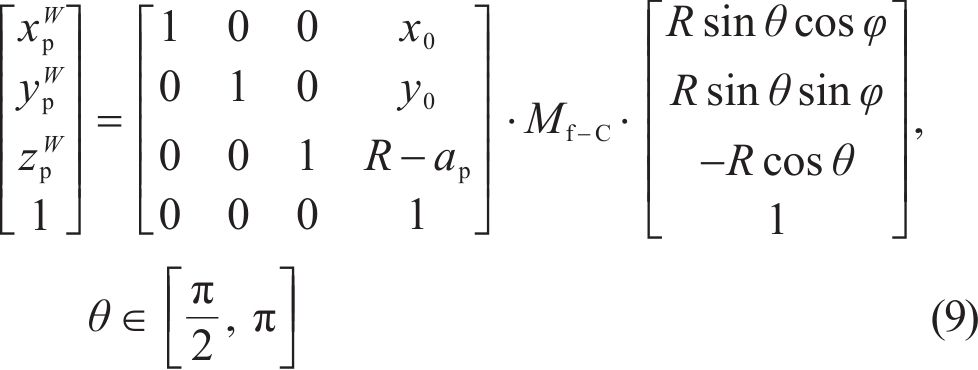
In the workpiece coordinate system {W}, the tangent relationship constraints such as formula (5) are applied to the parameter equation of the ball cutter edge line, and it can be obtained that under the current posture of the ball cutter, only the range of the axial angle θ∈[θ1, θ2] of the edge line participates in the cutting process of the workpiece. Meanwhile, the commonly used ap range of finishing machining is set to 0-1 mm, the range of the commonly used γ of the ball end milling cutter is set to 0-60°, and the radius of rotation of the contact area of the ball edge line under different parameters is shown in Figure 7(c).
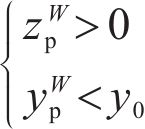
In Figure 7(c), the upper curved surface shows the maximum radius Rmax of the edge line tangential contact area, and the lower curved surface shows the minimum radius Rmin of the tangential contact area. A part of the lower curved surface is always 0, and this is due to the contact between the vertex of the ball cutter and the workpiece under the corresponding αp and γ. It can be seen from the results in the figure that the radius difference of the cutting contact area of the edge line changes nonlinearly with the difference of αp and γ of the ball cutter.
The relationship between the acquisition plane of the tool mark texture image and the position of the tool is demonstrated in Figure 8. When the cutting range [θ1, θ2] of the edge line is known, the cutting speed of a point P0 on the cutting edge line of the ball is mapped to the vertical coordinate l0 of the image acquisition plane through the geometric relationship shown in Figure 8. The relationship between Vc and l0 can be expressed as follows:
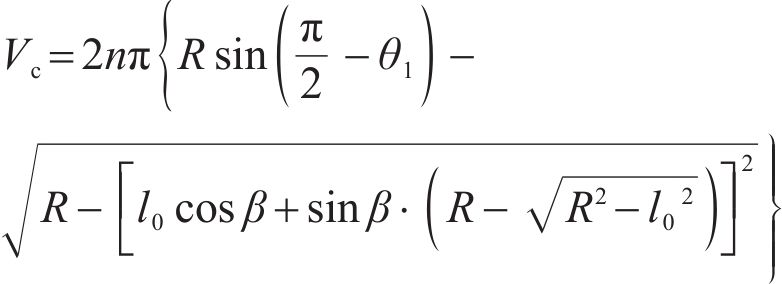
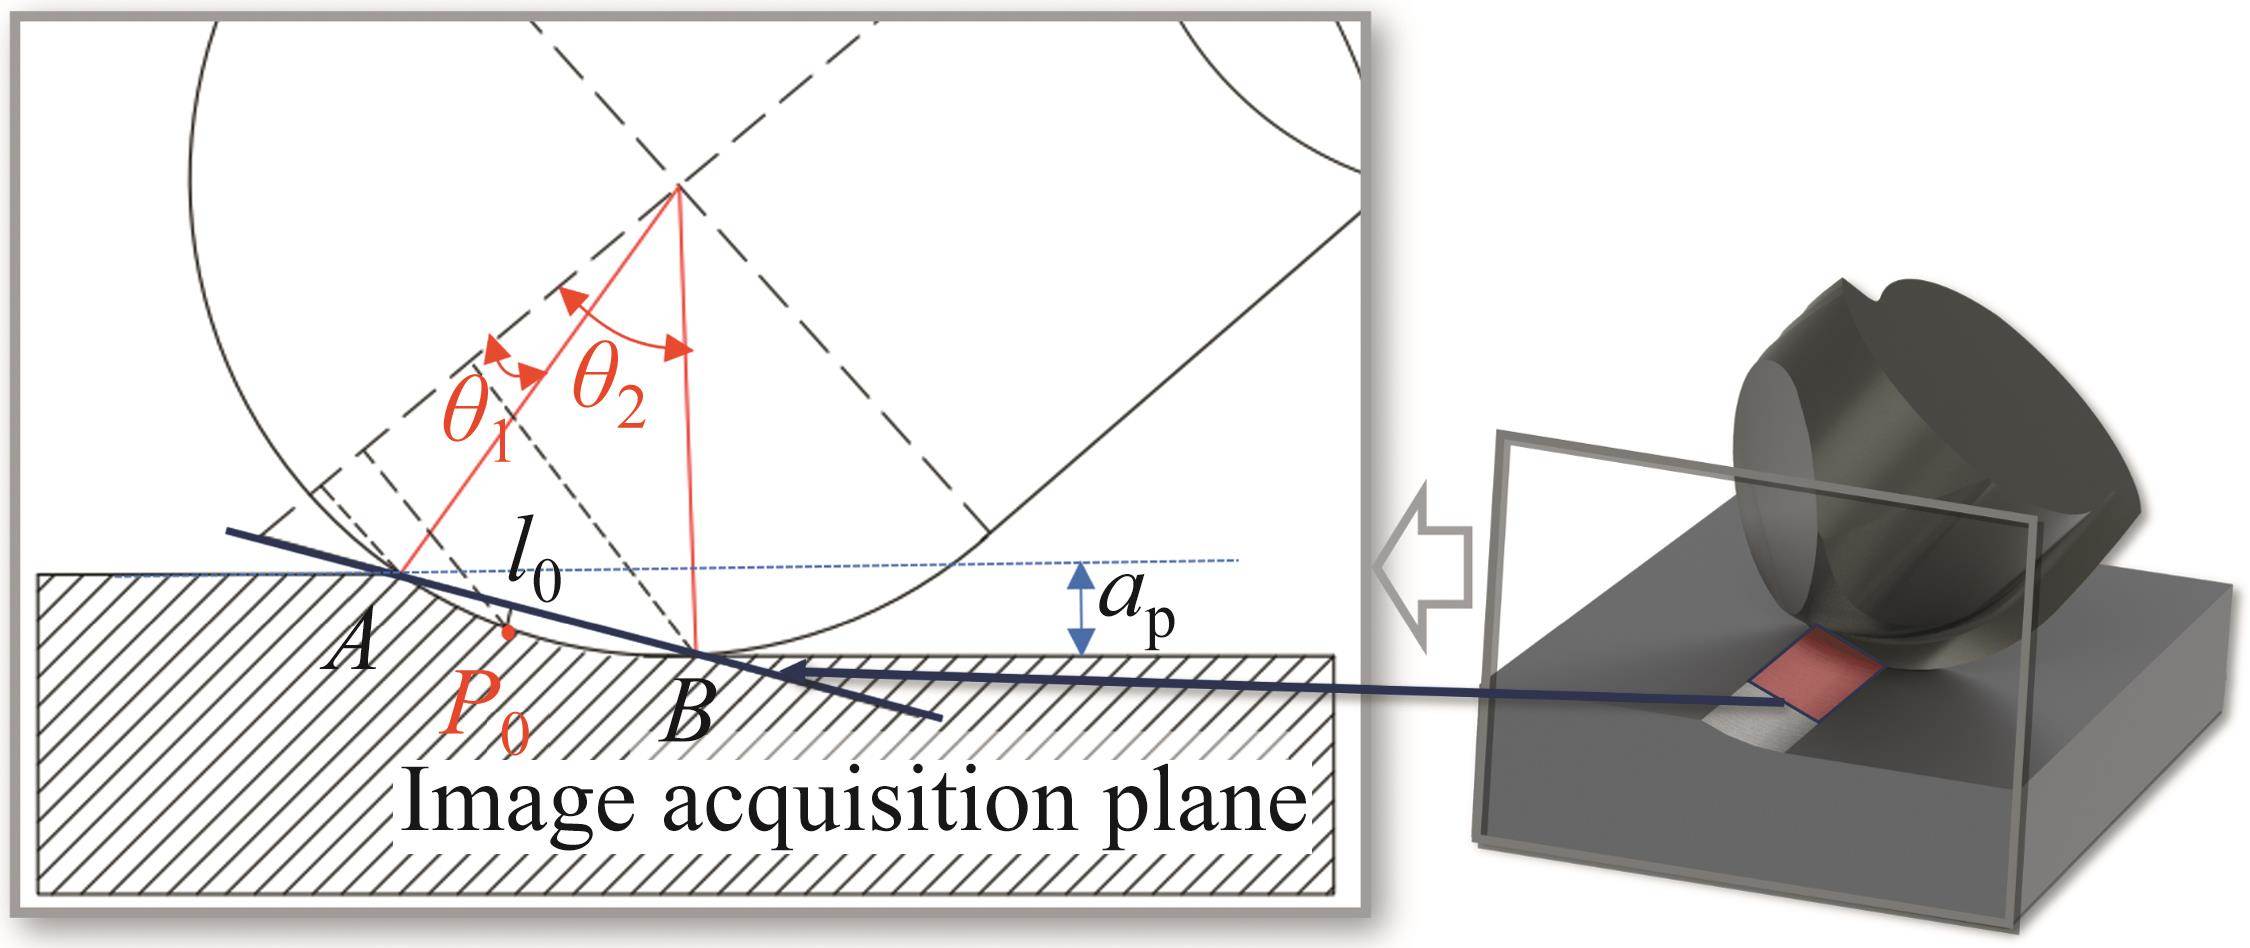
For the image ordinate l0, the corresponding angle θ of the tangent point of the tool edge line can be expressed as:

where R denotes the radius of the ball end milling cutter.
When judging the tool wear state based on the tool mark texture image, the longitudinal axis of the image is firstly divided into regions to refine the specific position of the ball edge line when predicting the tool wear. Then, the texture description algorithm proposed in Section 3.2 is employed to extract the texture feature values of the image in each region, and the wear of the corresponding edge line position is predicted.
In the law shown in Section 3.1, there is a simple linear relationship between the degree of texture slippage and the degree of tool wear W at the same cutting speed. Thus, in the process of wear mapping, only the proportional parameter K is set for this law, to express the mapping relationship between them through formula (13).

According to the effect of cutting speed on the wear texture morphology introduced in Section 3.1, the cutting speed influencing factor κ is established as follows:

where the change of the influencing factor with the position of the vertical coordinate of the image is adjusted by changing the parameters ε and κ, to adapt to the effect of cutting speed on the wear texture under different working conditions.
Thus, the mapping relationship between the wear at a certain position of the edge line of the ball end mill and the feature extracted from the tool mark texture image can be expressed as:

In the above formula, the selection of K can be determined only by a small number of data samples, and the mapping relationship does not vary with the change of processing parameters in the milling process. The speed influencing factor K is determined by the parameters ε and τ in the formula, and the two parameters are mainly selected through experience. Specifically, ε is related to the properties of the material, and the recommended value range is 0.1-0.5; τ is related to the processing parameters, and the recommended value range is 0.2-0.5. In this paper, ε=0.1 and τ=0.5 are selected for the finishing condition of hardened steel.
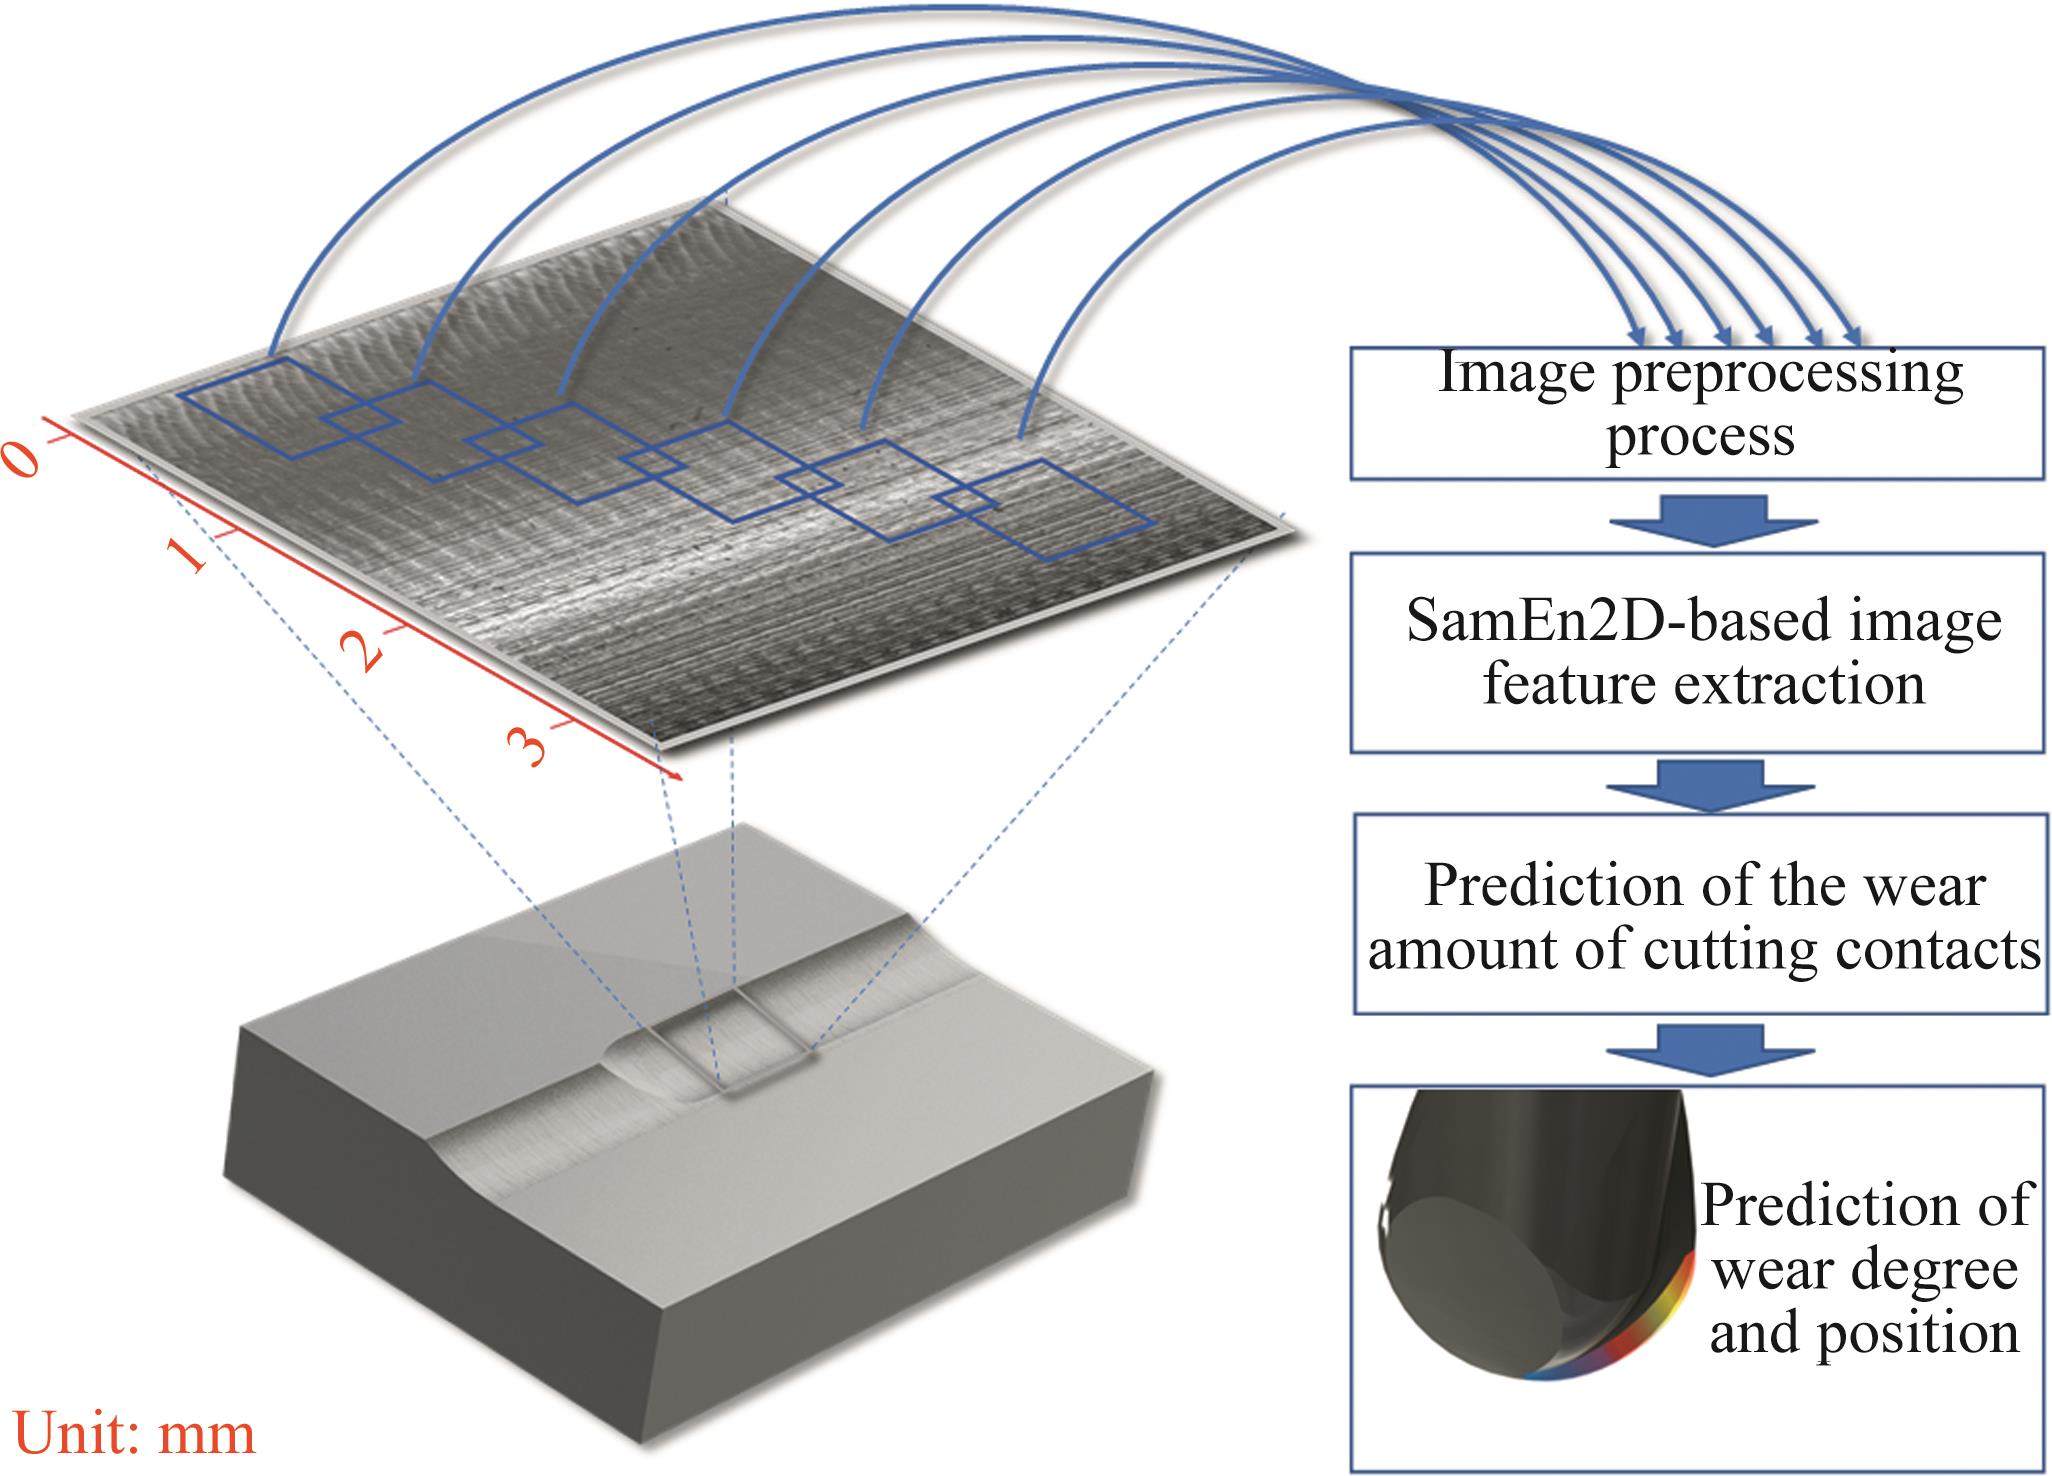
The process of predicting the wear state of the ball end milling cutter is shown in Figure 9. When collecting the surface texture image of the tool mark, the different ordinate positions of the tool mark surface are sampled simultaneously, and the image is preprocessed by using the SampEn2D algorithm proposed in Section 3.2 to quantify the texture features at different sampling positions. Then, the wear amount mapping relationship discussed in Section 3.3 is exploited to predict the wear amount of the ball end milling cutter edge line contact area corresponding to different sampling positions, and finally, the state of the tool wear degree and wear position is predicted using the current tool mark texture image.
4 Results and discussion
4.1 Analysis of texture description ability based on SampEn2D method
This section discusses the effect of the SampEn2D algorithm proposed in Section 3.2. A set of texture images whose gray values fluctuate sinusoidally along the horizontal direction is established to test the algorithm, as shown in Figure 10(a). The degree of texture slippage in the image demonstrates a gradual growth trend.
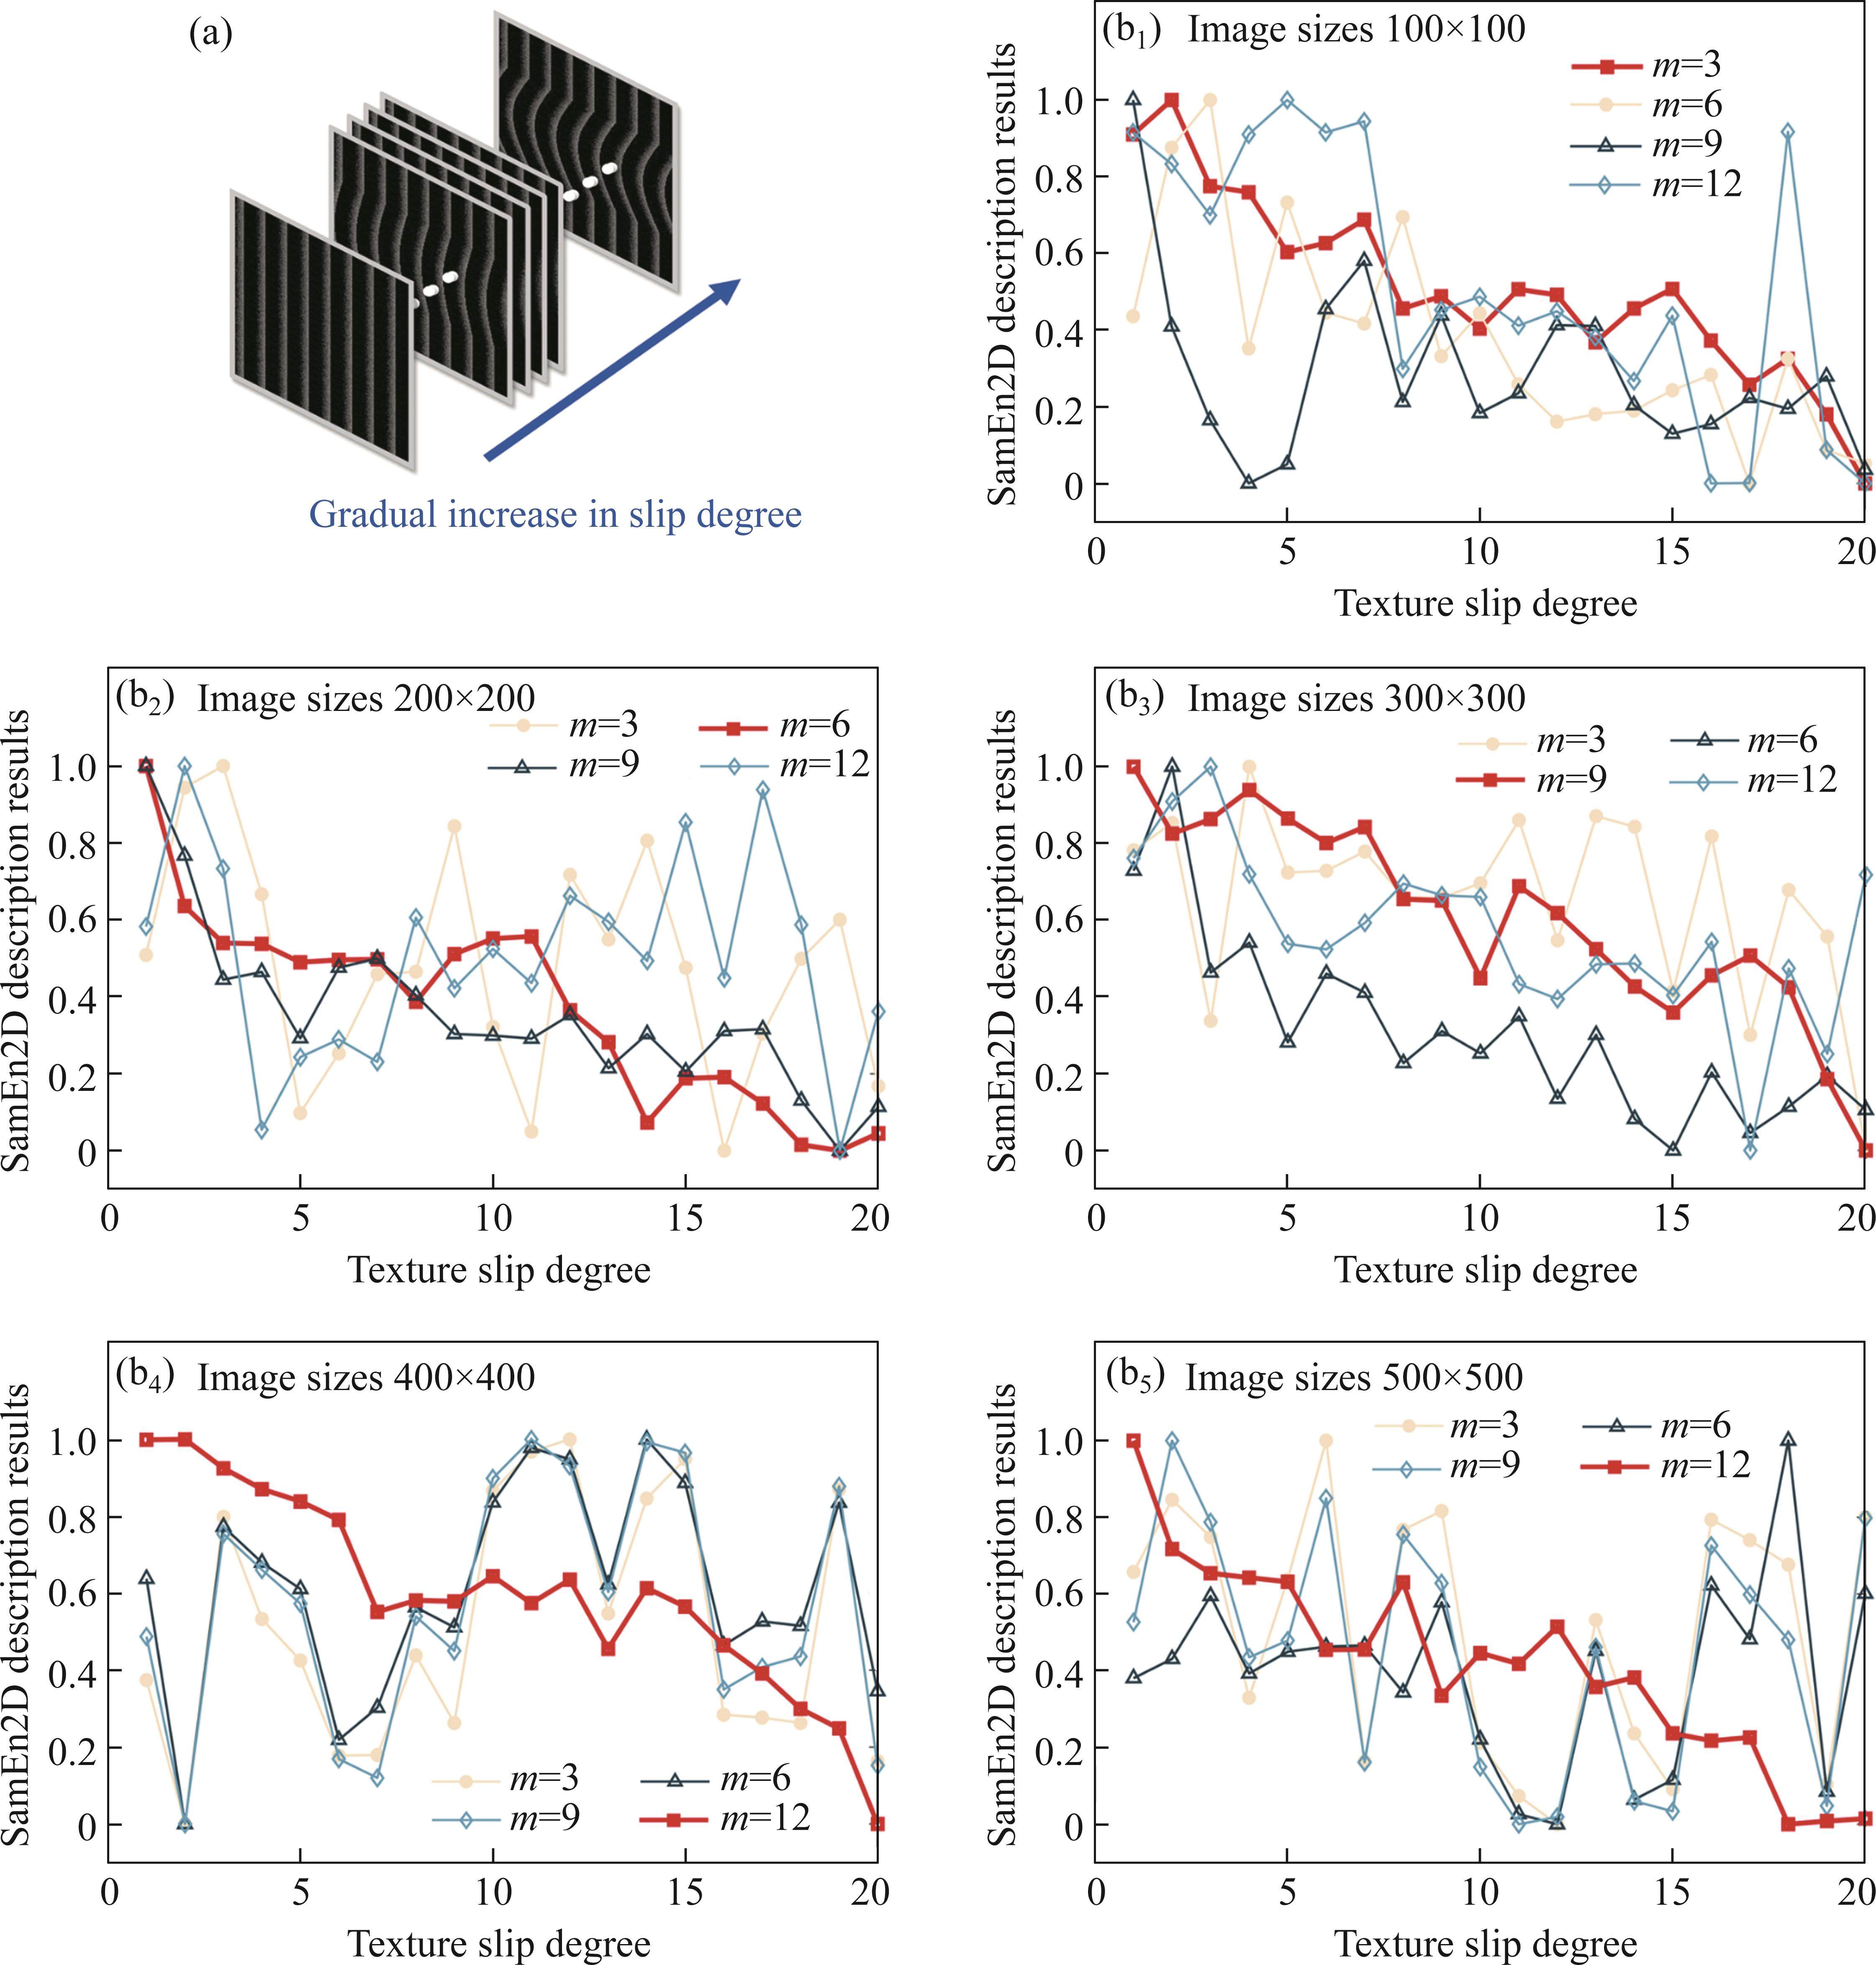
Firstly, according to experience, the optimal window size selection is investigated under the threshold r=0.15, β=45°, and step size of 2. Here, five sets of tests are conducted for image sizes ranging from 100×100 to 500×500. Affected by image size and computing time, the K value in each set of tests is constant at 3. By taking the correlation between the algorithm result and the degree of simulated image slippage as the evaluation index, the algorithm effect is compared under four window sizes m=3, 6, 9 and 12.
It can be seen from the results in Figure 10(b) that when the image size is small, a small window size leads to the best texture description effect, and the correlation between the description result and the actual value reaches 92.12%. As the image size increases gradually, the optimum window size increases accordingly. The test results of five images indicate that the description effect is the best when the window size accounts for 2%-3% of the entire image size.
This is because the improved SampEn2D algorithm integrates the gradient direction of the image pixel value as the basis for judging similar pixel statistics, which quantifies the process of obtaining the directional shape of the texture into calculating the image entropy value. On the one hand, a smaller window size can capture a more stable local texture gradient direction during the image statistics process, thereby enhancing the accuracy of texture description. On the other hand, a window of appropriate proportions can capture local information while considering the global information of the image. This balance enables the algorithm to describe the texture features of the image more accurately and achieve the best description effect.
Additionally, this group of images was used to compare the CON and IDM parameters in the GLCM [9] that are sensitive to the tool wear texture, and compare our algorithm with the description algorithm based on the entropy concept used in other studies [18]. Figure 11 shows the variation of the texture feature values extracted by each description algorithm with the degree of texture slippage. The correlations between CON and IDM in the GLCM and the degree of slippage are 63.62% and 52.75%, respectively. The entropy concept algorithm proposed by other researchers has a description correlation of 89.40%. Since the method in this paper is targeted to improve the texture feature, the description correlation reaches 94.54%, which is better in the tool state prediction scenario based on the tool mark texture description.
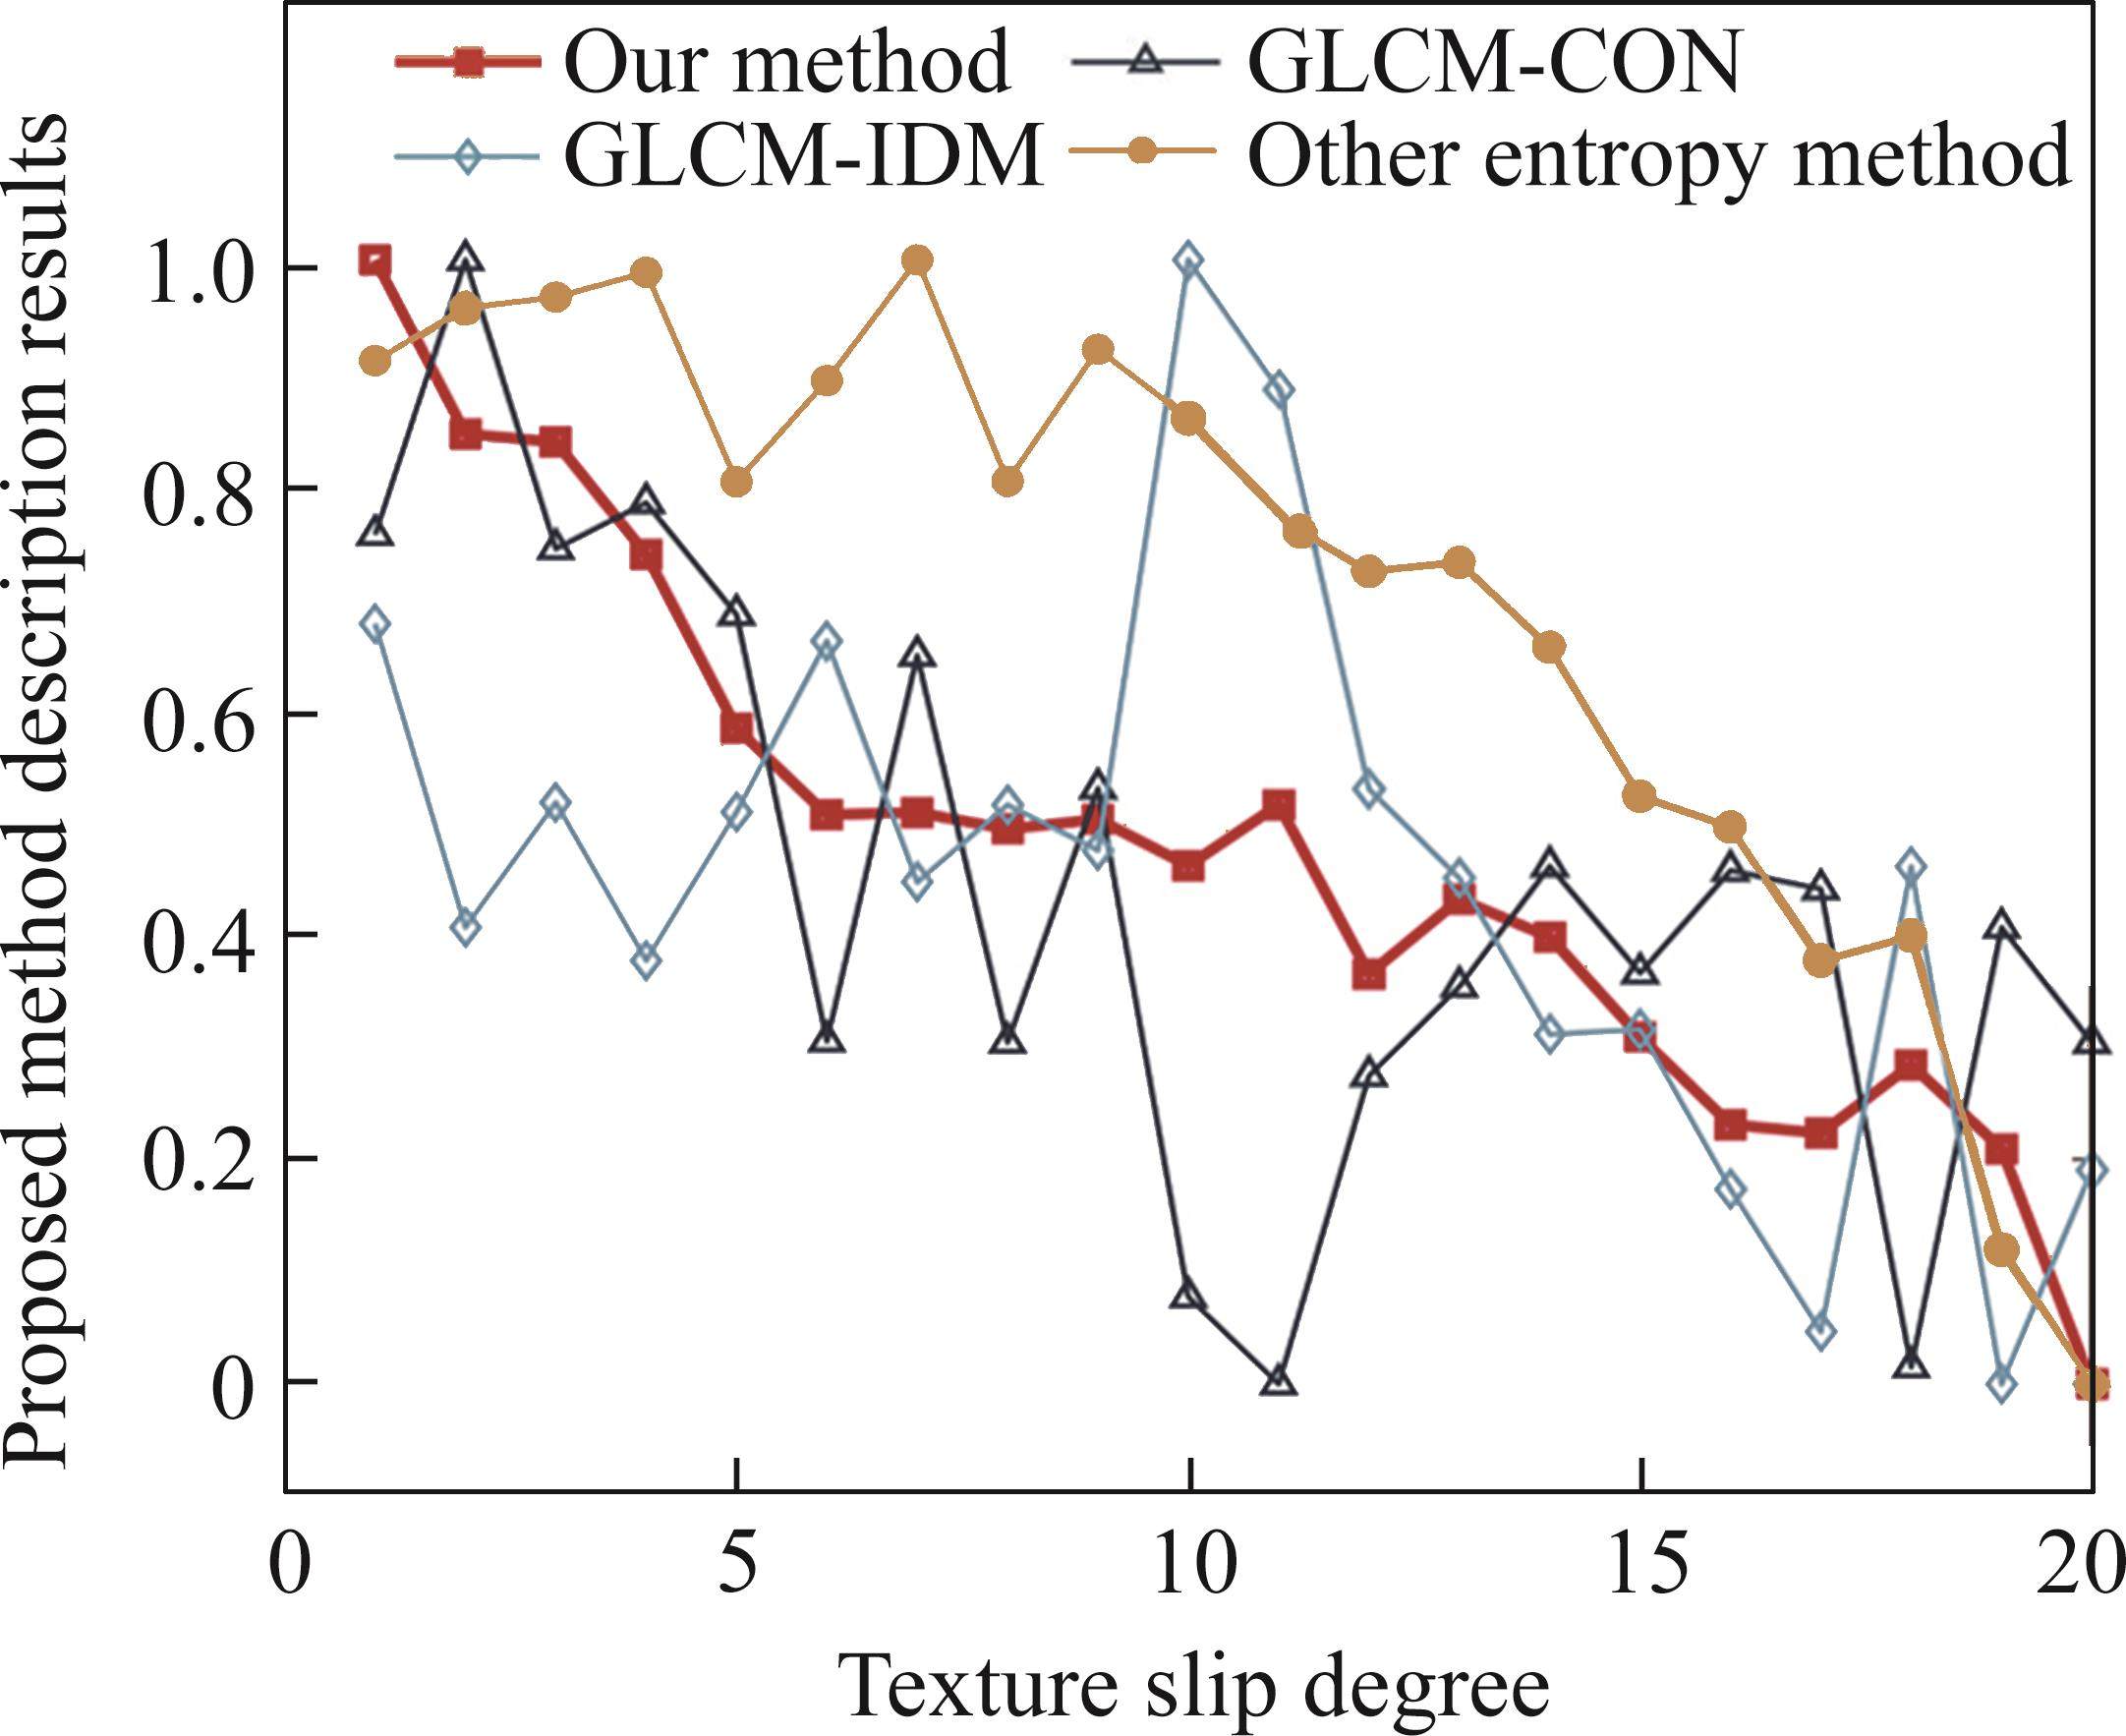
There are two main reasons why the GLCM method is not suitable for gradually changing texture description: Firstly, GLCM describes texture features by counting the gray-level co-occurrence frequencies between pairs of adjacent pixels. Since there is no obvious step change in pixel values in gradually changing textures, it is difficult to record texture changes by the gray co-occurrence matrix. Secondly, GLCM needs to discretize the image gray value when counting the gray co-occurrence matrix. This method filters out the continuous small changes in the image gray value, so it is insensitive to small changes in textures. SILVA et al [16] also found similar characteristics of GLCM when describing the Broadtz image data set.
The texture description algorithm based on image entropy is different from the GLCM statistical pixel pair, which considers the pixel distribution of the entire image. It measures the complexity of the image and the degree of texture changes by calculating the entropy of similar feature blocks in the image [18]. Additionally, the texture description algorithm based on image entropy does not operate discretely on pixel values but performs statistics on their continuous distribution. These two features enable it to better capture subtle changes in gradually changing textures. The method proposed in this paper aims at the progressive bending changes in the tool wear texture, and it integrates the perception of the texture direction when counting similar pixel blocks using the entropy method, so it can enhance the bending characteristic texture, leading to more accurate feature extraction and higher description robustness and accuracy.
4.2 Discussion on tool condition monitoring method based on tool mark texture image
This section discusses the proposed tool life prediction method and uses the sample data prepared in the tool wear experiment to analyze and compare the effect of the proposed method.
The traditional method of determining tool wear based on processed surface images predicts the overall tool life by analyzing the overall surface image after processing, but the prediction result cannot be refined to specific tool locations. The method proposed in this paper only considers the tool mark of a single feed and divides the surface of the tool mark based on the cutting speed in more detail, thus enabling the prediction of the wear amount at each position of the tool. The results of these two methods are different and cannot be directly compared. Therefore, this section compares the prediction accuracy of the proposed method and traditional methods for predicting the wear amount of a single worn position on a milling cutter. Secondly, the prediction accuracy of the proposed method is compared with that of common non-visual measurement methods to verify its reliability.
4.2.1 Comparison between proposed method and existing methods based on processed surface texture images
Compared with traditional methods, our method incorporates a partition judgment process based on cutting speed in the process of extracting image features to reflect wear. To verify the effectiveness of this scheme, three sets of cutting speed wear sample data are selected here, and the two-dimensional sample entropy algorithm and the cutting speed compensation method proposed in the paper are taken as the scheme in this paper. Taking the GLCM grayscale co-occurrence matrix image feature description without compensation as a traditional method, the difference between the predicted values and the actual values is compared. The experimental results are presented in Figure 12(a).
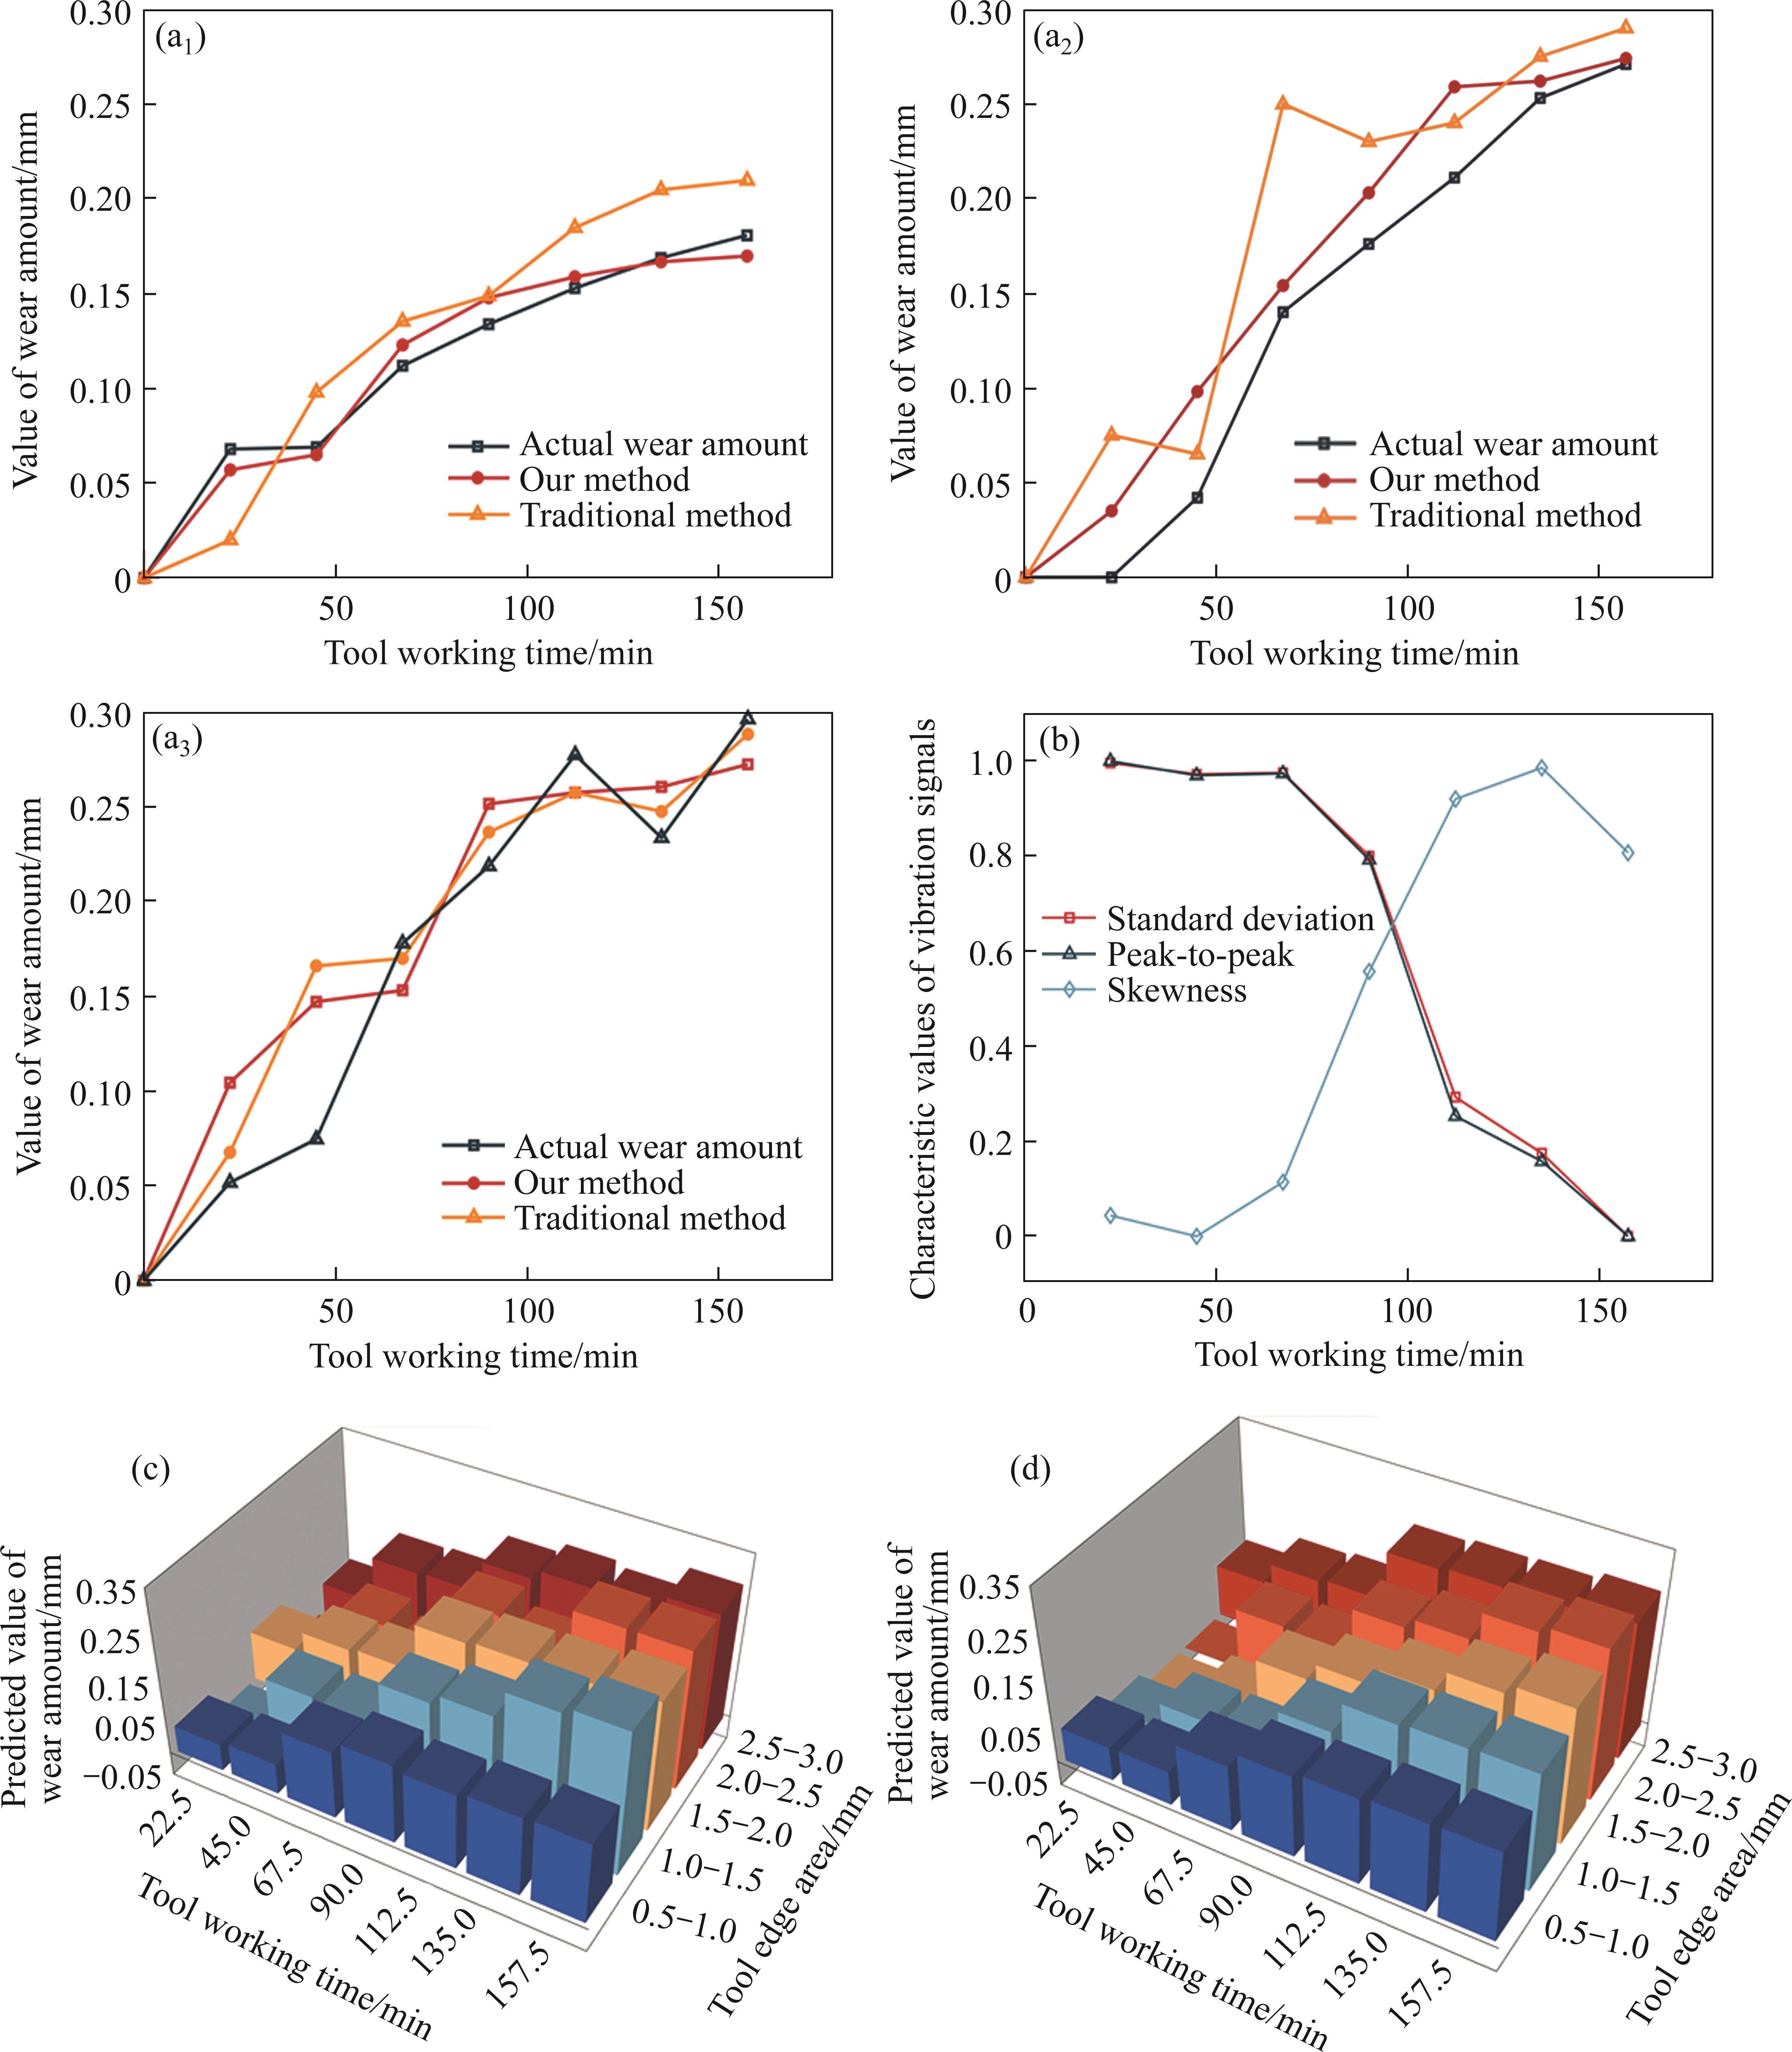
In the experiment with different speed groups, the results without cutting speed compensation exhibit a certain degree of deviation from those of the method proposed in this paper. The root mean square error (RMSE), which can visually reflect the magnitude of the difference between the predicted value and the actual value, is used here as a quantitative indicator of prediction accuracy. The results are listed in Table 2.
| Vc/(m∙min-1) | Our method | Traditional method | ||
|---|---|---|---|---|
| RMSE | Correlation/% | RMSE | Correlation/% | |
| 18.6 | 0.009 | 98.9 | 0.036 | 95.8 |
| 43.6 | 0.015 | 98.2 | 0.031 | 94.8 |
| 69.14 | 0.007 | 98.1 | 0.018 | 94.4 |
The results indicate that at three different cutting speeds, the RMSE and correlation of this method are better than those of the traditional method and are closer to the true value of milling cutter wear. As shown in Figure 12(a), the traditional method produced large jumps at 20- 60 min, 40-80 min and 40-80 min in the three sets of experiments. This is consistent with the progressive texture description of the GLCM method analyzed above. However, one disadvantage is that its discrete operation on image pixels causes texture changes before they are perceived. Additionally, in the three sets of experiments, as the cutting speed increases, the offset between the predicted value and the real value of the traditional method gradually increases. Although the method proposed in this paper also reflects the offset trend, the offset remains within a reasonable range, which confirms the effectiveness of the cutting speed compensation in this method.
4.2.2 Comparison between this method and non-visual monitoring methods
Firstly, the method proposed in this paper is compared with the vibration sensor detection method shown in Figure 1(c), which is widely used in tool condition monitoring. The existing methods for monitoring tool state through sensors usually fuse the signals of multiple sensors, and different feature extraction methods and fusion analysis models have a great impact on the final results. However, sensor methods are only suitable for predicting the overall state of the tool and cannot be refined down to the location of wear. Therefore, only by extracting the vibration signals collected during the milling process, the effect of the method proposed in this paper is compared in terms of changing trends.
The vibration signal consistent with the feed direction of the tool during the milling process is selected, an interval of 1 s in the stable cutting process is intercepted, and the changes of the normalized standard deviation, peak-to-peak value, and skewness with the cutting time of the tool is shown in Figure 12(b). The correlation between the test and the measured wear values falls between 96.5% and 97.5%.
The sample data were used to test the prediction effect of the proposed method under the tool wear state. ε=0.1 and τ=0.5 were selected as parameters in the wear mapping process, and the results are shown in Figure 12(c). The test results indicate that the relevance between the predicted value and the measured value obtained by the proposed method reaches 95.32%, which is close to the result of the tool condition monitoring method using sensors, and the prediction accuracy of the ball end milling cutter wear position and wear degree reaches 82.73%.
Through the above comparison, it is found that the correlation between the measurement results of the vibration sensor and the actual value is higher than that of the method proposed in this paper. This is because small changes in tool wear during the machining process will directly cause changes in the milling force [6], which is further demonstrated in the amplitude, frequency, phase, and other characteristics of the vibration signal. Vibration sensors usually have high sensitivity and can capture small vibration changes, so it can accurately sense the development process of tool wear.
Figures 12(c) and (d) compare the actual value of tool wear with the predicted value given by this method. It can be seen that the overall prediction trend of this method in terms of ball cutter wear position and wear value is consistent with the actual one. Some position prediction values between 45 and 112 min fluctuated, but this phenomenon did not appear in the experiment of simulating texture. Therefore, it can be determined that this phenomenon is caused by the acquisition process of the tool mark texture: it is affected by the noise and light changes of the image acquisition equipment; meanwhile, the chips, oil stains, and burrs on the surface of the milling tool mark interfere with the extraction of the tool mark texture features.
5 Conclusions
This study summarizes the characteristic changes in the tool mark texture on the machined surface with tool wear through wear experiments using Cr12MoV hardened steel materials and TiAlN-coated carbide ball end mills. Considering this characteristic, an image texture description method based on improved two-dimensional sample entropy is established. The wear state of ball-end milling cutters is predicted by using the mapping model between the cutter mark texture image and the cutting position of the milling cutter edge line. The following conclusions are drawn:
1) After the ball-end milling cutter is worn, the texture morphology of the tool mark is characterized by the slip deformation of the longitudinal feed texture along the sweeping direction of the cutter teeth. As the amount of wear further increases, the slip texture width and length increase linearly with it, and the correlation between the two and the wear amount reaches 96.51% and 96.95%, respectively. Among them, the slip texture width is more sensitive to tool wear.
2) The cutting speed of the contact point between the ball cutter and the workpiece has a great impact on the formation of the wear texture characteristics of the tool mark. By observing the corresponding tool mark texture when the wear amount at different positions of the milling cutter edge line in the experimental sample data reached 0.12 mm, it was found that as the cutting speed continues to increase, the wear characteristics produced by the same wear amount in the tool mark texture continue to weaken. Meanwhile, the degree of texture irregularity shows an exponential relationship with the increase in cutting speed.
3) This paper proposes a texture description algorithm based on image two-dimensional sample entropy, which integrates the perception of texture direction to make the progressive changes in the texture shape of tool marks more obvious. By using a set of gradually changing texture image tests, it was found that the correlation between the SampEn2D description result and the actual value reaches 94.54%. The description effect is best when the search window size set in the algorithm accounts for 2%-3% of the entire image size.
4) The correlation between the tool wear value predicted by the proposed method and the actual measured value is up to 95.32%, and the prediction accuracy reaches 82.73%. The prediction accuracy under various working conditions is higher than that of the traditional prediction method based on tool mark texture. However, in the image acquisition process, affected by factors such as the adhesion of impurities on the tool mark surface, light changes, and visual sensor noise, the predicted values still fluctuate slightly.
5) The data samples obtained from the experiments were used in this paper to compare and analyze the wear change trends measured by the proposed method and the vibration sensor. The correlation between the characteristic results measured by the vibration sensor and the true value of wear ranges between 96.5% and 97.5%. The correlation of the proposed method is 95.32%, which is slightly lower than the sensor method, but it meets the accuracy requirements of condition monitoring for intelligent management of tool life while reducing equipment costs.
Early fault detection of machine tools based on deep learning and dynamic identification
[J]. IEEE Transactions on Industrial Electronics, 2019, 66(1): 509-518. DOI: 10.1109/TIE.2018. 2807414.Implementation of remote monitoring system for prediction of tool wear and failure using ART2
[J]. Journal of Central South University of Technology, 2011, 18(1): 177-183. DOI: 10.1007/s11771-011-0677-7.An accurate transient model for temperature fluctuation on localized shear band in serrated chip formation
[J]. International Journal of Mechanical Sciences, 2021, 204: 106588. DOI: 10.1016/j.ijmecsci.2021.106588.A new geometric model of serrated chip formation in high-speed machining
[J]. Journal of Manufacturing Processes, 2021, 62: 632-645. DOI: 10.1016/j.jmapro.2020.12.053.Influence and prediction of tool wear on workpiece surface roughness based on milling topography analysis
[J]. The International Journal of Advanced Manufacturing Technology, 2022, 122(3): 1883-1896. DOI: 10.1007/s00170-022-09939-x.Study on ploughing phenomena in tool flank face-workpiece interface including tool wear effect during ball-end milling
[J]. Tribology International, 2023, 181: 108313. DOI: 10.1016/j.triboint.2023.108313.Optimisation of machining parameters during ball end milling of hardened steel with various surface inclinations
[J]. Measurement, 2017, 111: 18-28. DOI: 10.1016/j.measurement.2017.07.020.Digital tooth contact analysis of face gear drives with an accurate measurement model of face gear tooth surface inspected by CMMs
[J]. Mechanism and Machine Theory, 2022, 167: 104498. DOI: 10.1016/j.mechmachtheory.2021. 104498.Detection of tool condition from the turned surface images using an accurate grey level co-occurrence technique
[J]. Precision Engineering, 2012, 36(3): 458-466. DOI: 10.1016/j.precisioneng.2012.02.004.Correlation study of tool flank wear with machined surface texture in end milling
[J]. Measurement, 2013, 46(10): 4249-4260. DOI: 10.1016/j.measurement.2013.07.015.Progressive tool condition monitoring of end milling from machined surface images
[J]. Proceedings of the Institution of Mechanical Engineers, Part B: Journal of Engineering Manufacture, 2018, 232(2): 251-266. DOI: 10.1177/0954405416640417.Dissociation artificial neural network for tool wear estimation in CNC milling
[J]. The International Journal of Advanced Manufacturing Technology, 2023, 125(1): 887-901. DOI: 10. 1007/s00170-022-10737-8.Application of machine vision method in tool wear monitoring
[J]. The International Journal of Advanced Manufacturing Technology, 2021, 116(3): 1357-1372. DOI: 10.1007/s00 170-021-07522-4.Quantitative evaluation method of tool wear based on morphological characteristics of machined surfaces
[J]. Proceedings of the Institution of Mechanical Engineers, Part B: Journal of Engineering Manufacture, 2023, 237(1, 2): 81-90. DOI: 10.1177/09544 054221092941.An approach of multiscale complexity in texture analysis of lymphomas
[J]. IEEE Signal Processing Letters, 2011, 18(4): 239-242. DOI: 10.1109/LSP.2011.2113338.Two-dimensional sample entropy: Assessing image texture through irregularity
[J]. Biomedical Physics & Engineering Express, 2016, 2(4):Bidimensional distribution entropy to analyze the irregularity of small-sized textures
[J]. IEEE Signal Processing Letters, 2017, 24(9): 1338-1342. DOI: 10.1109/LSP.2017.2723505.Two-dimensional multiscale entropy analysis: Applications to image texture evaluation
[J]. Signal Processing, 2018, 147: 224-232. DOI: 10.1016/j.sigpro.2018.02.004.On the use of sample entropy to analyze human postural sway data
[J]. Medical Engineering & Physics, 2009, 31(8): 1023-1031. DOI: 10.1016/j.medengphy.2009.06.004.Comparison of different threshold values r for approximate entropy: Application to investigate the heart rate variability between heart failure and healthy control groups
[J]. Physiol Meas, 2011, 32(2): 167-180. DOI: 10.1088/0967-3334/32/2/002.An innovative geometric error compensation of the multi-axis CNC machine tools with non-rotary cutters to the accurate worm grinding of spur face gears
[J]. Mechanism and Machine Theory, 2022, 169: 104664. DOI: 10.1016/j.mechmachtheory.2021.104664.LI Mao-yue, LU Xin-yuan, LIU Ze-long and ZHANG Ming-lei declare that they have no conflict of interest.
LI Mao-yue, LU Xin-yuan, LIU Ze-long, ZHANG Ming-lei. Research on wear state prediction of ball end milling cutter based on entropy measurement of tool mark texture images [J]. Journal of Central South University, 2025, 32(1): 174-188. DOI: https://doi.org/10.1007/s11771-025-5855-0.
李茂月,卢新元,刘泽隆等.基于刀痕纹理图像熵测度的球头铣刀磨损状态预测方法研究[J].中南大学学报(英文版),2025,32(1):174-188.

