1 Introduction
Cutoff walls are barriers often used in geotechnical environmental engineering to control the spread of contaminated plumes at polluted sites [1-3]. The soil-cement-bentonite (SCB) backfill is a self-hardening slurry used to construct cutoff walls [4]. Compared with soil-bentonite and cement-bentonite backfills, the SCB backfill has sufficient strength to carry the loads and disturbances generated by the operation of industrial sites. The SCB backfill can also reduce wall construction costs by using the soil around industrial sites [5]. Meanwhile, the SCB backfill can block the propagation of contamination plumes at industrial sites because of its low permeability coefficient (<10-7 cm/s) achieved through the hydration of bentonite and cement. Thus, SCB cutoff walls are widely used at contaminated industrial sites [6-8].
Cement can enhance the strength of SCB cutoff walls and reduce their permeability through hydration reactions. Therefore, cement is an important component of the SCB backfill, and accounts for a relatively large proportion of SCB backfill costs. However, the manufacture of cement uses a tremendous amount of energy and releases CO2 into the atmosphere, adding to the greenhouse effect [9, 10]. Moreover, owing to the process requirements at some industrial sites, salt and sulfate ions in groundwater can adversely affect the hydration products of cement, which significantly affects the strength and impermeability of the backfill [11, 12]. Therefore, studies have been conducted to develop a new type of cementitious material that combines industrial solid waste and cement to improve the material performance and reduce costs and carbon emissions while increasing the degree of solid waste utilization. Currently, solid wastes, such as blast furnace slag, rock dust, fly ash, silica fume, and zeolite, are being studied in the field of concrete research [13-16]. HU et al [17] conducted an experimental study on the preparation of tailings backfill by replacing cement with stone powder. They found that the addition of stone powder promoted the late hydration reaction of the backfill, improved the microstructure, and reduced preparation costs. MIN et al [18] investigated the effects of ground blast furnace slag and cementitious material on the properties of phosphogypsum backfill. They found that ground blast furnace slag improved early hydration reactions and enhanced the strength of the material. ERCIKDI et al [19] discovered that partial replacement of cement with ground granulated blast-furnace slag (GGBFS) mitigated the strength loss of cemented backfill that used sulfide-rich tailings as an aggregate in the long run; however, the use of excessive amounts of GGBFS reduced the unconfined compressive strength. These studies demonstrate the prospects of preparing new cementitious materials from industrial solid waste.
One of the substances utilized as a cement substitute in backfill is silica fume [20]. The impact of silica fume on the engineering qualities of concrete materials has been examined in earlier studies. EKER et al [21] used industrial silica fume to replace cement in paste backfill. They confirmed that the silica fume improved the strength and durability of the backfill against a sulfate attack. Due to its capacity to alter the interfacial transition zone, NILI et al [22] found that the addition of silica fume significantly affected the strength of cement materials. ROSTAMI et al [23] and YOUM et al [24] conducted indoor tests on the stability of slag concrete containing silica fume. They showed that the silica fume enhanced the resistance of concrete to chloride ion erosion. YAN et al [25] used silica fume to enhance the performance of brine-containing backfill. They discovered that silica fume enhanced the backfill physical characteristics and resistance to erosion; however, adding too much silica fume decreased flowability of the slurry. According to previous studies, silica fume may combine with calcium hydroxide in hydration products to form beneficial compounds such as calcium silicate hydrate, which improves the microstructure. The strength and erosion resistance of the backfill can be greatly increased because silica fume reacts earlier and faster than other zeolite materials [26-28].
A review of previous studies reveals that they mainly investigated the performance of silica fume as a cement substitute in concrete materials with high cement content. However, soil is the main material for cutoff walls, and it has a low cement content. Few studies have examined the optimal silica fume substitution ratio for this type of material. Moreover, previous studies mainly explored how silica fume enhanced the strength of the materials, and paid little attention to its influence and mechanism on the strength and permeability. In this study, silica fume was used as a partial replacement for cement to prepare a silica fume-soil-cement-bentonite (SSCB) backfill. Their macroscopic and microscopic characteristics were investigated using experimental methods. In addition, the influence of the microscopic pore structure of the SSCB backfill on its macroscopic performance was analyzed by quantitatively describing the complexity of the pore structure through fractal theory. The specific objectives of this study are: 1) To optimize the mix proportion of silica fume in SSCB backfill based on macroscopic performance tests; 2) To investigate the effects of silica fume on the hydration products and pore structure of composite backfill by microscopic tests; 3) To elucidate the relationship between the microstructure and the macroscopic characteristics, and uncover the mechanism by which silica fume reduces the permeability of SSCB backfill.
2 Materials and methods
2.1 Materials
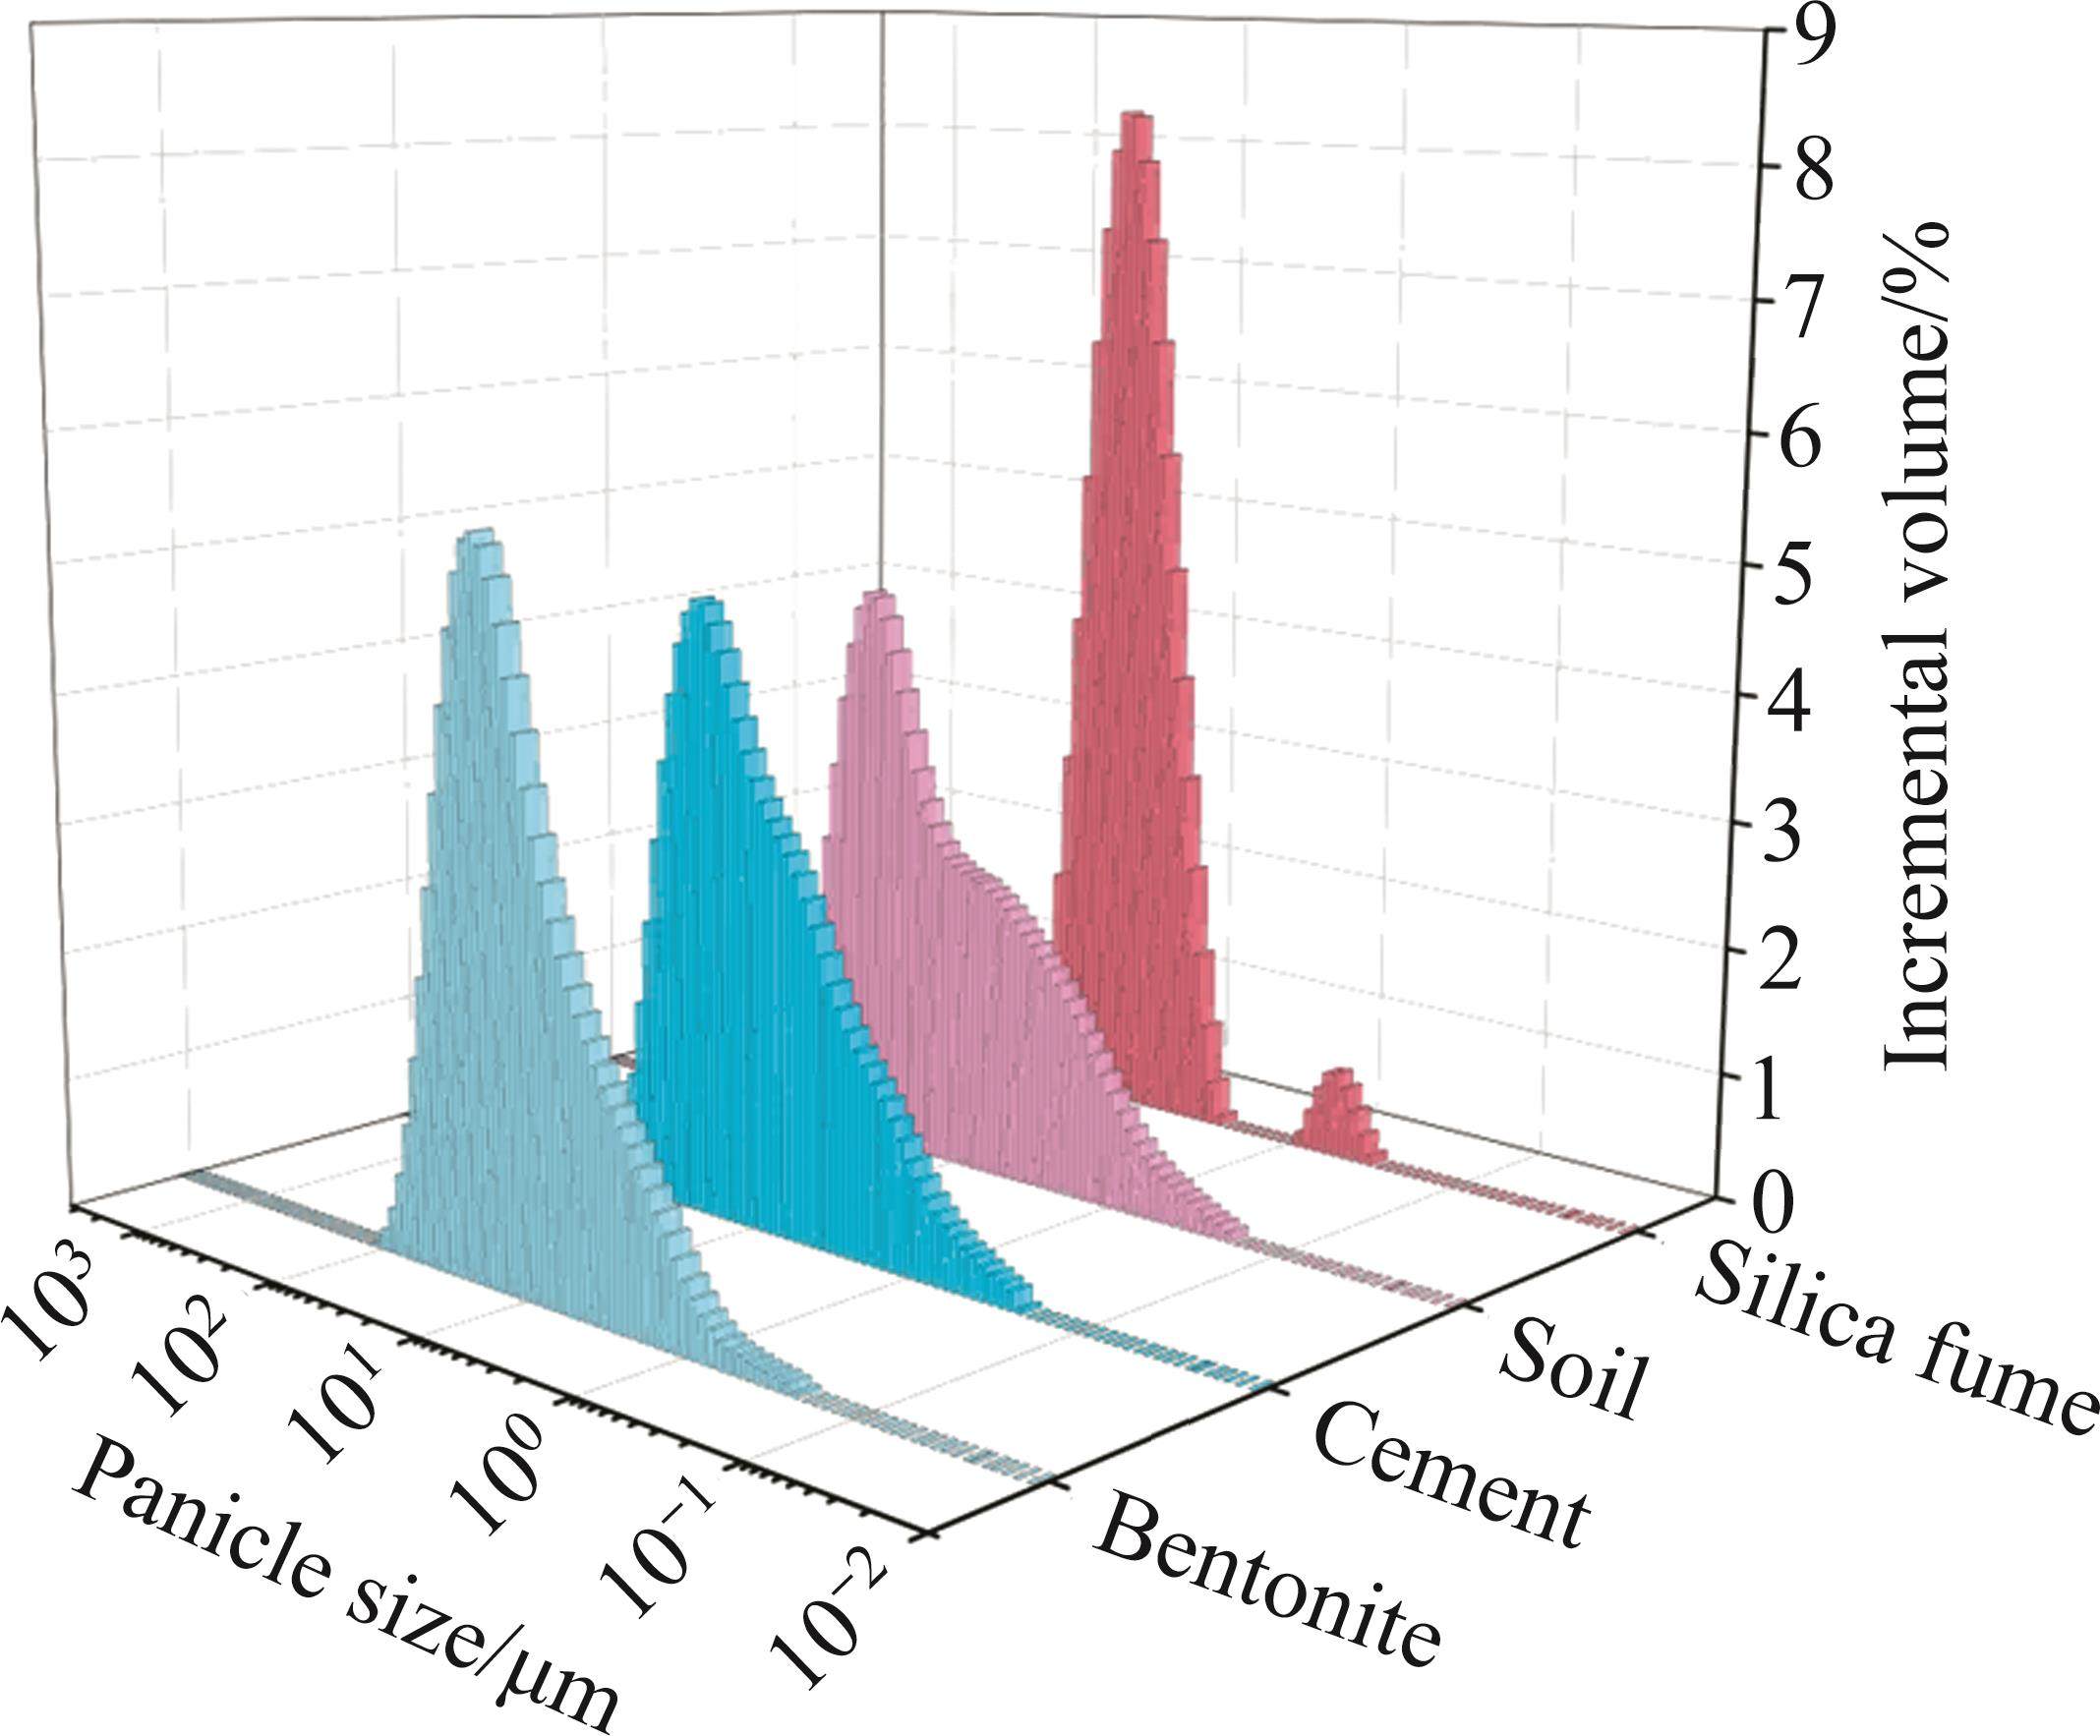
The SCB backfill materials include soil, bentonite, cement, and silica fume. The soil is widely distributed in the south-central region of China. The bentonite is from a supplier in Shandong Province, China. The cementitious material is ordinary 42.5 strength cement. The highly reactive silica fume used in this study is a byproduct of the ferrosilicon smelting process and was produced in Henan Province, China. Normal tap water was used for the experimental water, whose pH range is 6.5-8.5 and conductivity range is 0.5-5.0×10⁻² S/m. The physical properties of the materials are listed in Table 1. The particle size distributions are shown in Figure 1 and Table 2.
| Material | Calcite | Albite | Chlorite | Quartz | Amphibole | Mica | Plagioclase | Dolomite |
|---|---|---|---|---|---|---|---|---|
| Bentonite | 3.3 | — | — | 18.32 | — | 17.29 | — | — |
| Cement | 12.66 | — | — | 2.16 | — | — | — | — |
| Soil | 13.21 | 13.01 | 26.5 | 26.16 | 4.06 | 9.08 | 3.7 | 4.28 |
| Material | Calcium silicate | Larnite | Gypsum | Anhydrous gypsum | Brownmillerite | Montmorillonite | Feldspar | |
| Bentonite | — | — | — | — | — | 43.19 | 17.9 | |
| Cement | 48.5 | 14.59 | 1.01 | 5.09 | 15.54 | — | — | |
| Soil | — | — | — | — | — | — | — |
| Material | Characteristic diameter | Cu | Cc | ||
|---|---|---|---|---|---|
| D10 | D50 | D90 | |||
| Bentonite | 2.62 | 15.66 | 43.59 | 7.66 | 1.32 |
| Cement | 1.84 | 13.19 | 42.48 | 9.78 | 1.14 |
| Soil | 1.79 | 18.41 | 66.95 | 15.02 | 0.93 |
| Silica fume | 5.61 | 13.44 | 27.50 | 2.81 | 1.05 |
The particle size analysis showed that soil had a characteristic median particle size (D50) of 18.41 μm, a coefficient of uniformity (Cu) of 15.02, and a coefficient of curvature (Cc) of 0.93. Soil had a low coefficient of curvature (<1), indicating poor gradation. Cement had a characteristic median particle size of 13.19 μm, a coefficient of uniformity of 9.78, and a coefficient of curvature of 1.14, indicating good gradation. Bentonite had a characteristic median particle size of 15.66 μm, a coefficient of uniformity of 7.66, and a coefficient of curvature of 1.32, indicating good gradation.
2.2 Methods
2.2.1 Preparation of backfill
All the dry materials were dried in a blast. Bentonite and water were mixed and stirred for 5 min at high speed, and then left in a sealed container for 24 h to form a bentonite slurry. The bentonite slurry and the mixed dry materials were then blended for 5 min with a high-speed blender to produce SSCB backfill. Then, the slurry was cast into molds (φ50 mm×100 mm and 70 mm×70 mm× 70 mm) of different specifications. The molds were placed on a shaking table for 1 min to clear the air bubbles and increase the density of the slurry. Finally, the samples were demolded and placed in a curing environment (relative humidity >95%, (20±2) ℃ for (24±2) h). The various proportions of materials used in the experiment are listed in Table 3. It should be noted that the data on the reference group (T0) was obtained from the authors’ previous study [29].
| Group name | Bentonite | Soil | Cement | Silica fume |
|---|---|---|---|---|
| T0 | 9 | 82 | 9 | 0 |
| T5 | 8.55 | 0.45 | ||
| T10 | 8.1 | 0.9 | ||
| T15 | 7.65 | 1.35 | ||
| T30 | 6.3 | 2.7 |
2.2.2 Unconfined compressive strength test
The unconfined compressive strength (UCS) test was conducted with a SANS electronic pressure tester, which had a loading rate of 1 mm/min (maximum range 300 kN). Cylindrical specimens with a φ50 mm×100 mm were used for the UCS test. Three replicates were prepared for each mix proportion in this test, and the mean value was taken as the test result.
2.2.3 Permeability test
This test used a TST-55 permeability meter to measure the permeability coefficient of the specimens. The instrument was supplied by Nanjing Tuotest Instrument. The permeability tests on the specimens were carried out in strict compliance with the geotechnical testing standard. The test samples were taken from the specimen using a standard ring knife during the experiment. Three parallel samples were prepared for each mix proportion in this test, and the average value was selected as the test result.
2.2.4 Measurement of the pore structure
Nuclear magnetic resonance (NMR) is capable of characterizing the porosity of saturated samples, which represents a comparatively rational methodology for gauging SSCB backfill hydration [30].
We subjected saturated samples cured for 7 and 28 d to NMR test using the multifunctional nuclear magnetic resonance analyzer (Meso-MR23060H) [31-33]. Before the test, we subjected the sample to vacuum saturation for 10 h. The NMR test equipment was supplied by Shanghai Niumai Company. The test temperature was maintained at 26 ℃. The tests were conducted on φ50×100 mm cylindrical specimens. The T2 spectrum distribution obtained from the NMR test experiment was used to analyze the pore size distribution.
Equation (1) demonstrates the connection between relaxation time (T2) and pore structure in NMR testing [34]:

where r is the pore radius; T2 is the transverse relaxation time; ρ2 is the transverse surface relaxation strength; Fs is the pore shape factor (for spherical pores, Fs=3; for tube bundle pores, Fs=2); and S/V is the pore surface area to fluid area ratio.
2.2.5 Microstructural studies
A JSM-IT500LV scanning electron microscope (SEM) was used to study the microstructural characteristics of the SSCB backfill samples. A sample smaller than 1 cm3 is removed from the center of the damaged specimen of the UCS test. The samples are cleaned, dehydrated and dried. The test was commissioned to the Testing Centre of Changsha Research Institute of Mining and Metallurgy.
2.2.6 X-ray diffraction (XRD) analysis
In this experiment, SSCB backfill samples were cured for 7 and 28 d, respectively. They were then dried in a dryer until no weight loss occurred, removed, and ground into powder. The powder was then analyzed by XRD using a Bruker D8 Advance diffractometer.
3 Results
3.1 Strength characteristics
Silica fume was used to partially replace the cement in the SSCB backfill at substitution ratios of 0% (T0), 5% (T5), 10% (T10), 15% (T15), and 30% (T30). Figure 2 shows the relationship between the silica fume substitution ratios, curing time and UCS of SSCB backfills.
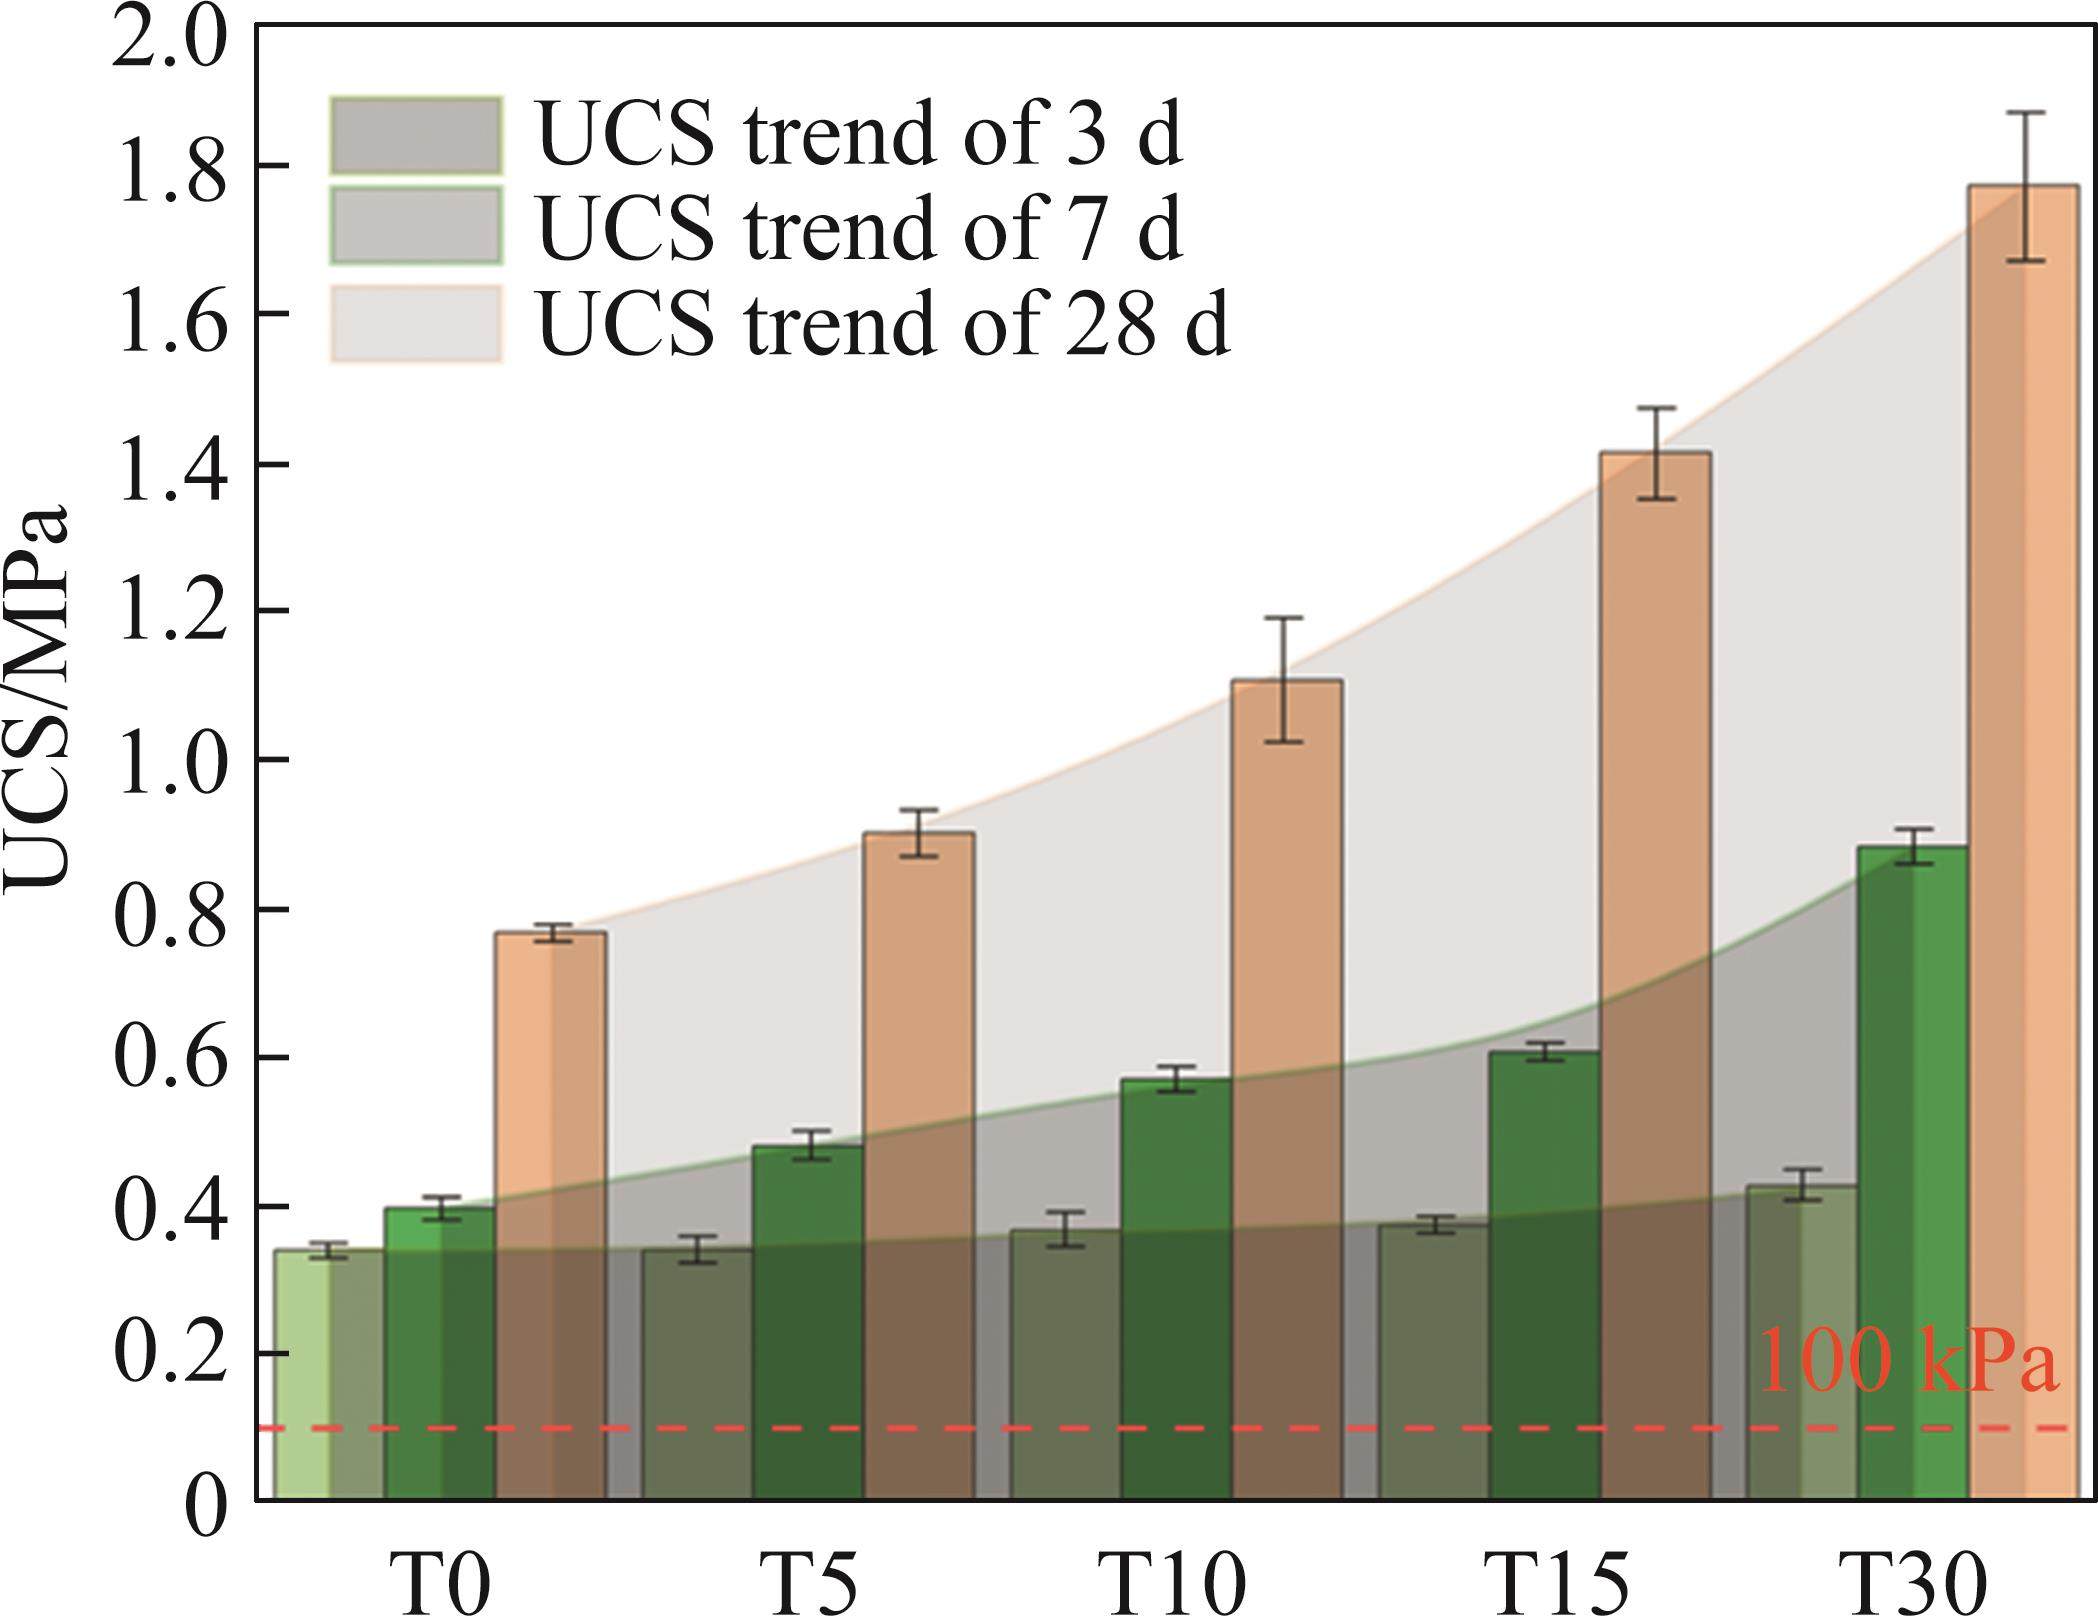
The results demonstrated that the UCS of the SSCB backfill was significantly different from that of the SCB backfill containing only cement (T0, reference group). For the SSCB backfill with a 5% substitution ratio (group T5), 28 d of curing led to a 17.4% increase in the UCS relative to group T0, reaching 0.902 MPa. The UCS of the remaining groups increased by 44.3% (T10), 84.2% (T15), and 131.1% (T30) relative to group T0, respectively. These indicate that the addition of silica fume improved the strength of the backfill. Thus, the contribution of silica fume to the UCS increased with the increase in the substitution ratio. It should be noted that the 28-d strength growth rate of the silica fume substitution rate gradually decreased as it increased from 15% to 30%, indicating that the effect of the substitution ratio on the strength is not proportional. A possible reason is that the pozzolanic reaction of silica fume mainly consumes the calcium hydroxide (C-H) generated by cement hydration. As the silica fume substitution rate increases, the cement content decreases, resulting in less available C-H and less hydration products.
The experimental findings demonstrated a distinct temporal pattern of contribution to the UCS by the cementitious material comprised of cement and silica fume in the SSCB backfill. The effects of different silica fume substitution ratios on the SSCB backfill are shown in the shaded plot of the UCS intensity variations in Figure 2. As seen, the interval growth rate of the UCS for different silica fume substitution ratios was low after 3 d of curing, while the upper boundary of the shaded area changed more gradually. As the curing time increased to 7 and 28 d, the upper boundary of the shaded area gradually became steeper and the interval growth rate of the UCS for different substitution ratios gradually increased. In the middle and late stages of curing, the addition of silica fume increased the UCS and had a positive effect on the hydration reaction of the backfill.
3.2 Permeability
Figure 3 depicts the correlation between the permeability coefficients and various silica fume substitution ratios for the SSCB backfill at various curing durations. With the exception of group T0, the permeability coefficients of the SSCB backfills in the remaining groups met the required cutoff wall permeability coefficient (<10-7 cm/s). At this time, the permeability coefficient of group T5 was 7.44×10⁻⁸ cm/s, a decrease of 50.0% compared with that of group T0. The permeability coefficients of the remaining groups of SSCB backfills decreased by 65.3% (T10), 90.2% (T15), and 90.7% (T30) compared with group T0, respectively. It is clear that the addition of silica fume decreased the backfill permeability coefficient and considerably improved the cutoff wall’s impermeability performance. With the increase in the silica fume substitution ratio, the rate of change of the permeability coefficients of the SSCB backfills gradually decreased.

The patterns of change of the permeability coefficients of the SSCB backfills varied with different substitution ratios and curing time. To illustrate these changes, the interval rates of change of the permeability coefficients of the five groups of SSCB backfills were calculated and analyzed. For example, after 3 d of curing, the reduction rate of the permeability coefficient of each group compared with the previous group was 6%, 5%, 12% and 1%. Similarly, after 28 d of curing, the reduction rate of the permeability coefficient of each group compared with the previous group was 49.7%, 31.1%, 71.8% and 4.6%, respectively. After 7 d of curing, the reduction rate of the permeability coefficient of each group compared with the previous group was 12.3%, 9.2%, 48.2% and 88.8%, respectively. Figure 3 shows that the permeability coefficients of the SSCB exhibit similar patterns of change after 3 and 28 d of curing, i.e., a gradual decrease followed by the stabilization. After a 7 d curing period, an increase in the silica fume substitution rate corresponded with a gradual decrease in permeability coefficient, alongside an escalating reduction rate. The results indicate that the permeability coefficient of the SSCB backfill decreased with the addition of silica fume. Moreover, the permeability of the cutoff wall was reduced significantly earlier with a certain amount of silica fume, which is beneficial for practical applications. The 28 d permeability coefficient showed no significant reduction with the increase of the silica fume replacement ratio from 15% to 30%, implying that there was an optimal silica fume replacement ratio.
3.3 Pore structure
In this study, NMR tests were performed on the 5 groups of SSCB backfills after 28 d of curing. We obtain the pore size distribution curves of the five groups of SSCB backfills in the saturated state, as shown in Figure 4 [35]. Two well-separated peaks (from left to right), i.e., peak 1 and peak 2, can be observed in both pore size distribution curves in Figure 4. Peak 1 represents the distribution and proportion of small pores in the backfill. Peak 2 represents the distribution and proportion of big pores in the backfill.
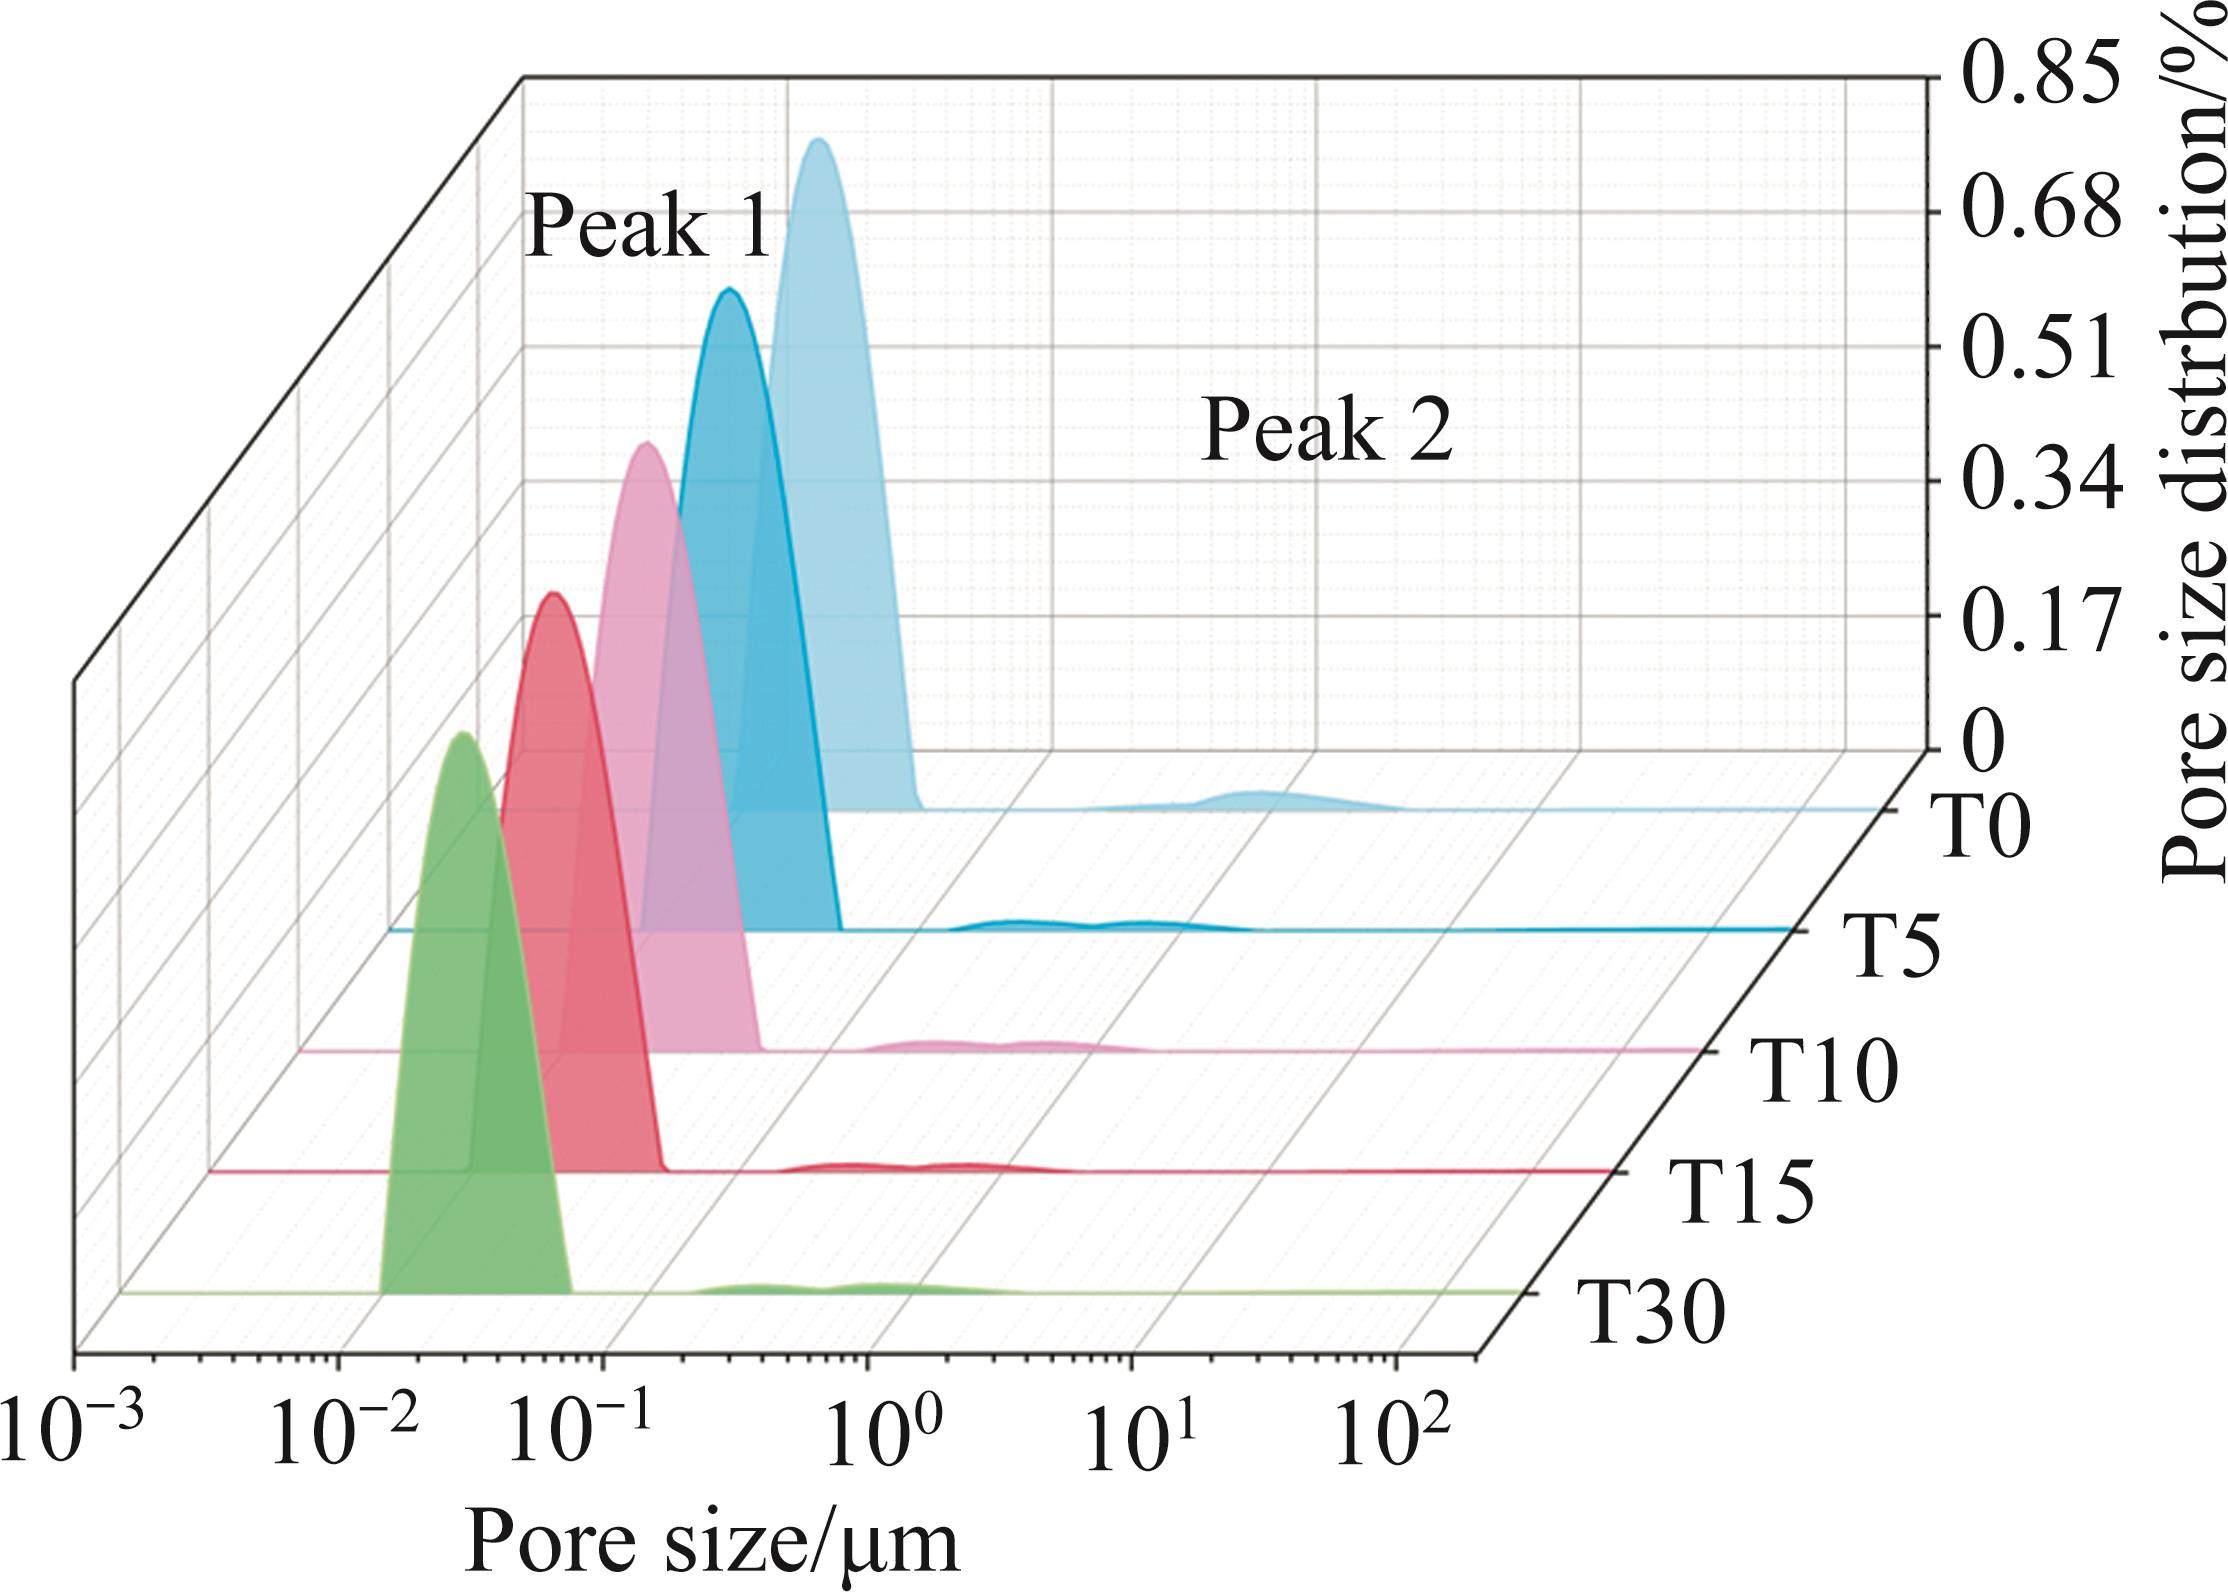
The SSCB backfill contains a majority of small pores, as seen by the peak’s height in the pore size distribution curve. When the silica fume substitution ratio in the backfill increased, the pore size distribution of the small pores did not change significantly, but their proportion decreased. After 28 d of curing, peak 2 of group T0 exhibited a single peak morphology, with the highest point at the posterior part of peak 2. Compared with group T0, peak 2 of groups T5, T10, T15 and T30 exhibited a broader range of pore size distributions. It is noticeable that peak 2 of the pore size distribution curve underwent a right-to-left shift and clearly displayed a bimodal feature. This indicates that the addition of silica fume reduced the overall size of big pores and significantly improved their structure in the SSCB backfill. Overall, the pore structure of the backfill is significantly optimized when silica fume is used to replace some of the cement.
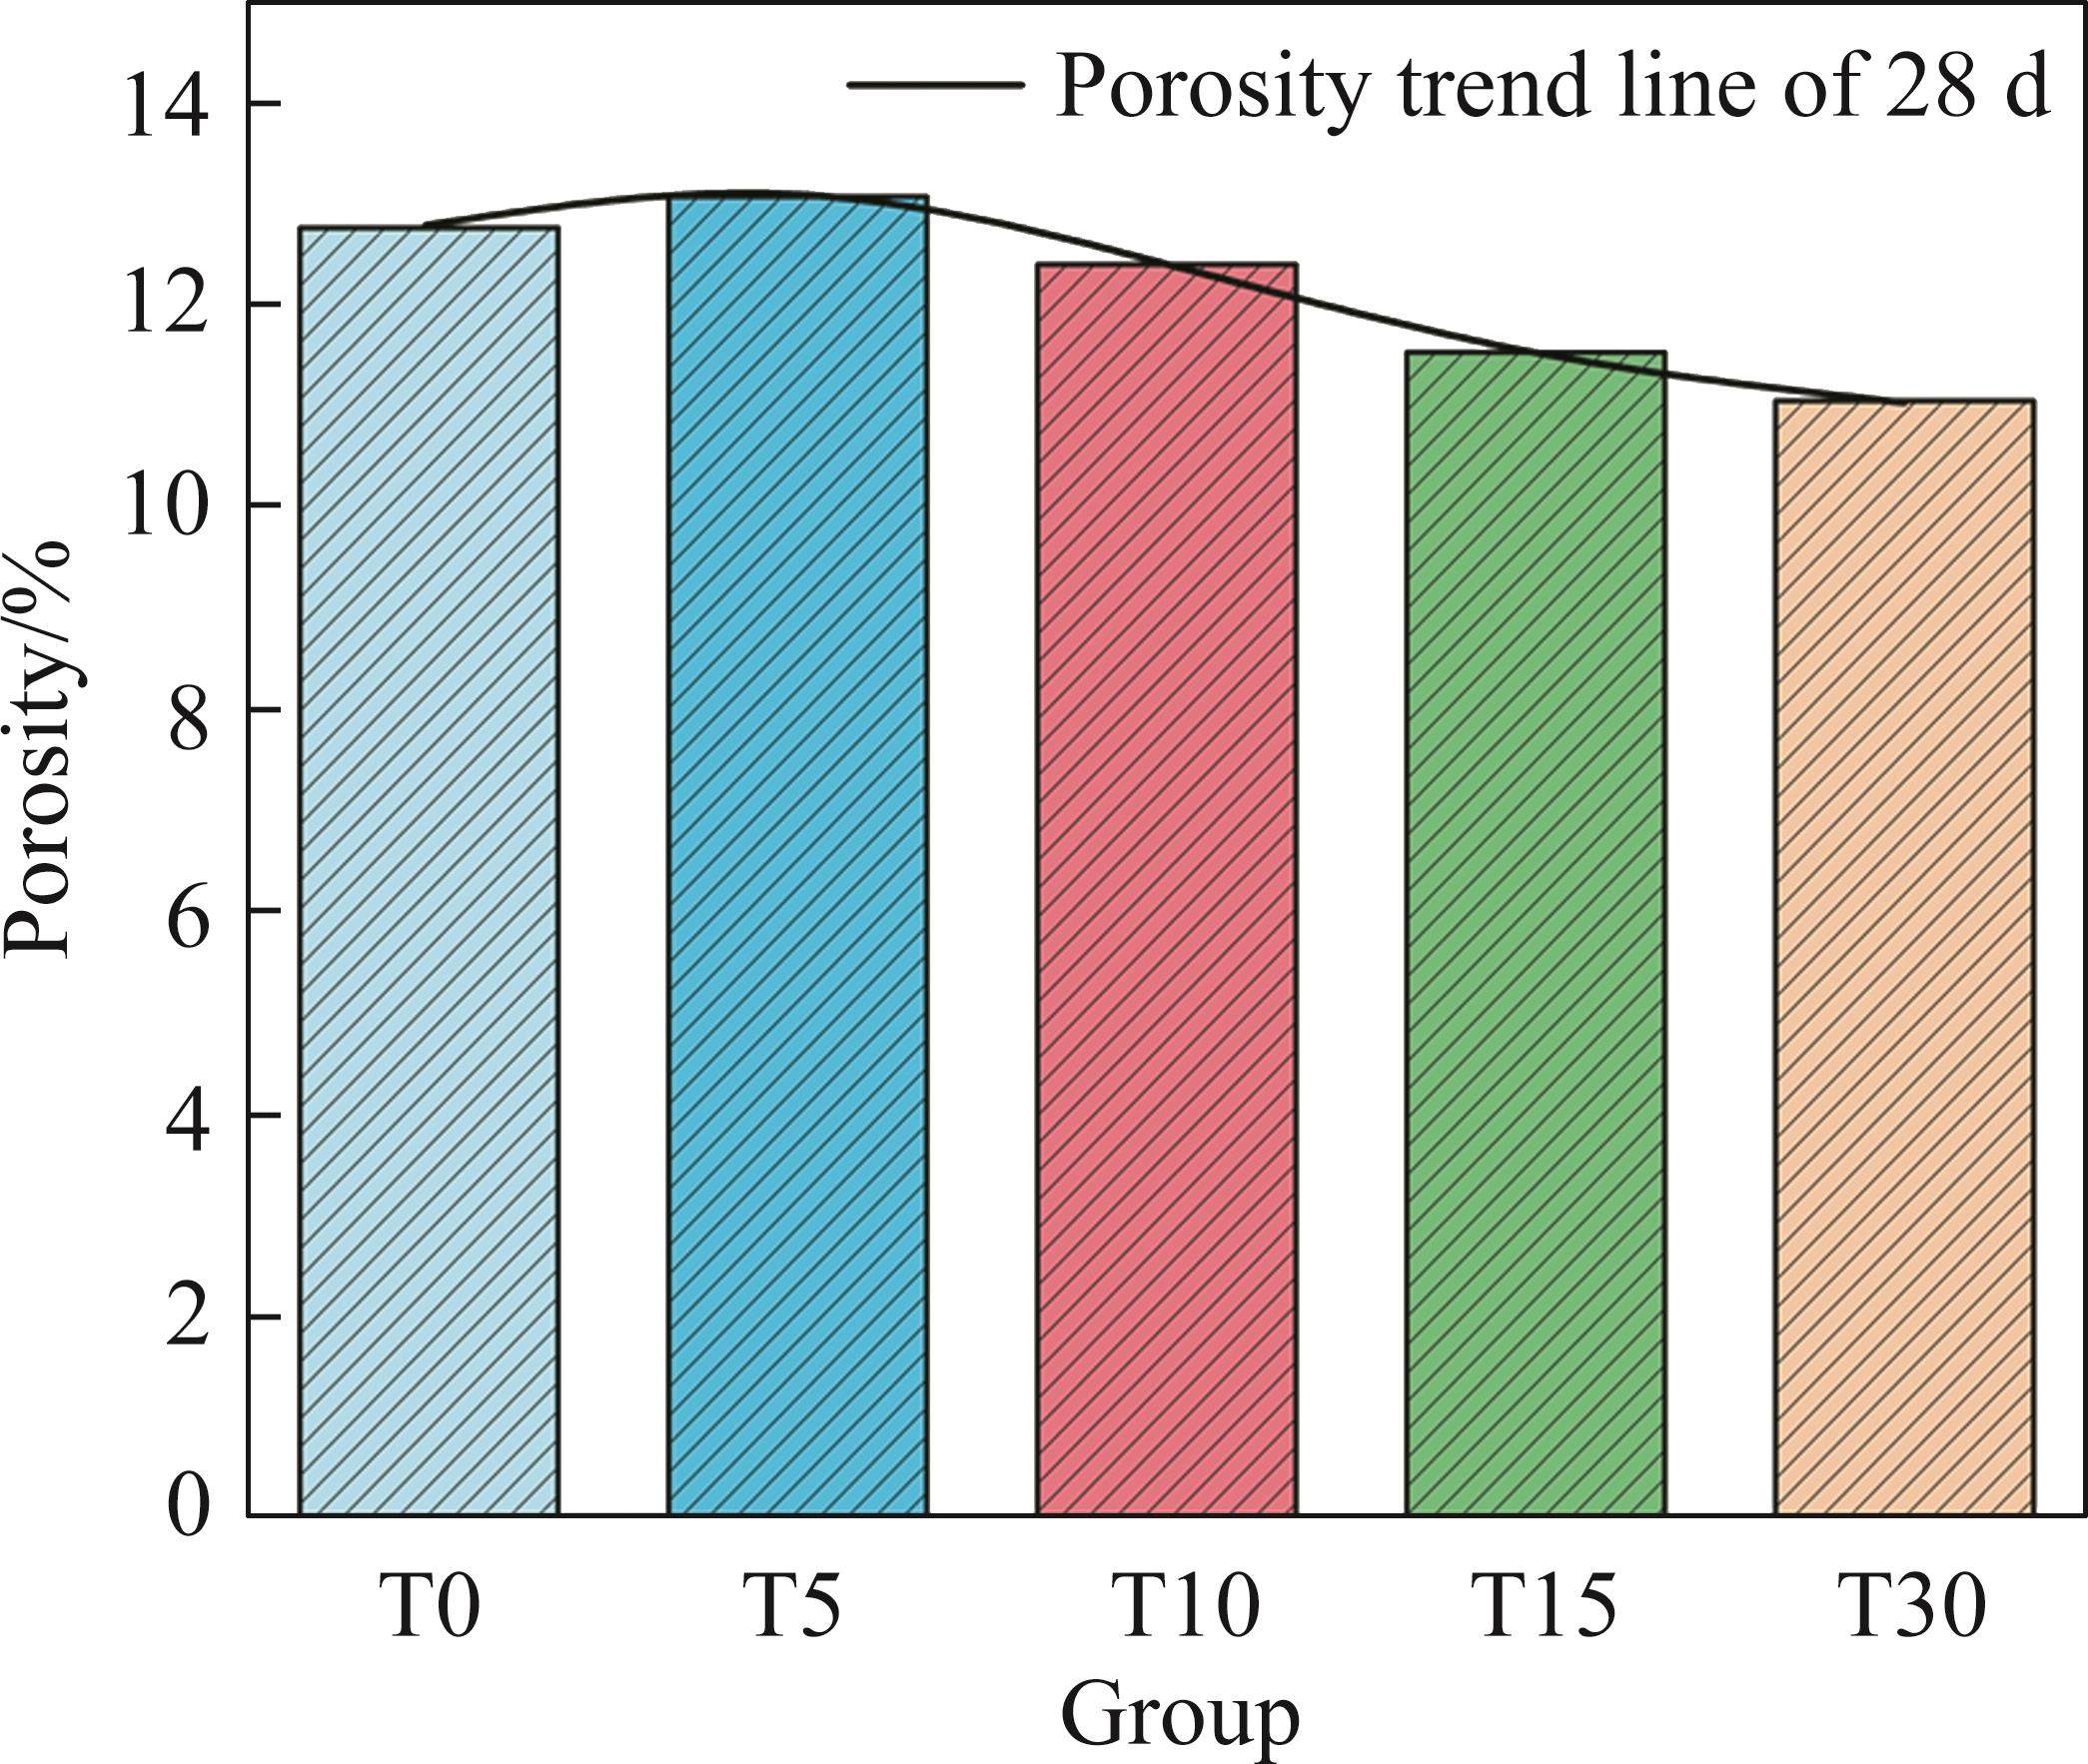
Figure 5 shows the porosity and porosity trends of specimens from the 5 groups of backfills with different silica fume substitution ratios after 28 d of curing. The porosity of group T15 decreased by 9.6% compared with that of group T0. The porosity of group T30 decreased by 4.1% compared with that of group T15. The overall trend of the backfill porosity showed a decrease and then leveled off with the increase in the substitution ratio. This implies that the combined silica fume and cement material has a greater filling effect on the SSCB backfill than the addition of cement alone. However, there is an upper limit to the silica fume substitution ratio. A high substitution ratio did not significantly contribute to the backfill porosity.
3.4 Mineralogical composition and microstructure of SSCB backfill
Figure 6 displays the XRD patterns of group T0 and T10 backfills after 7 and 28 d of curing. The comparison of the XRD spectra of groups T0 and T10 at different curing periods showed no significant difference with the material composition between the two groups, and only a change in the material content was observed. Ettringite (AFt), hydrotalcite-like phases (Ht), calcium silicate hydrates (C-S-H), and calcium hydroxide (C-H). were the predominant hydration products.
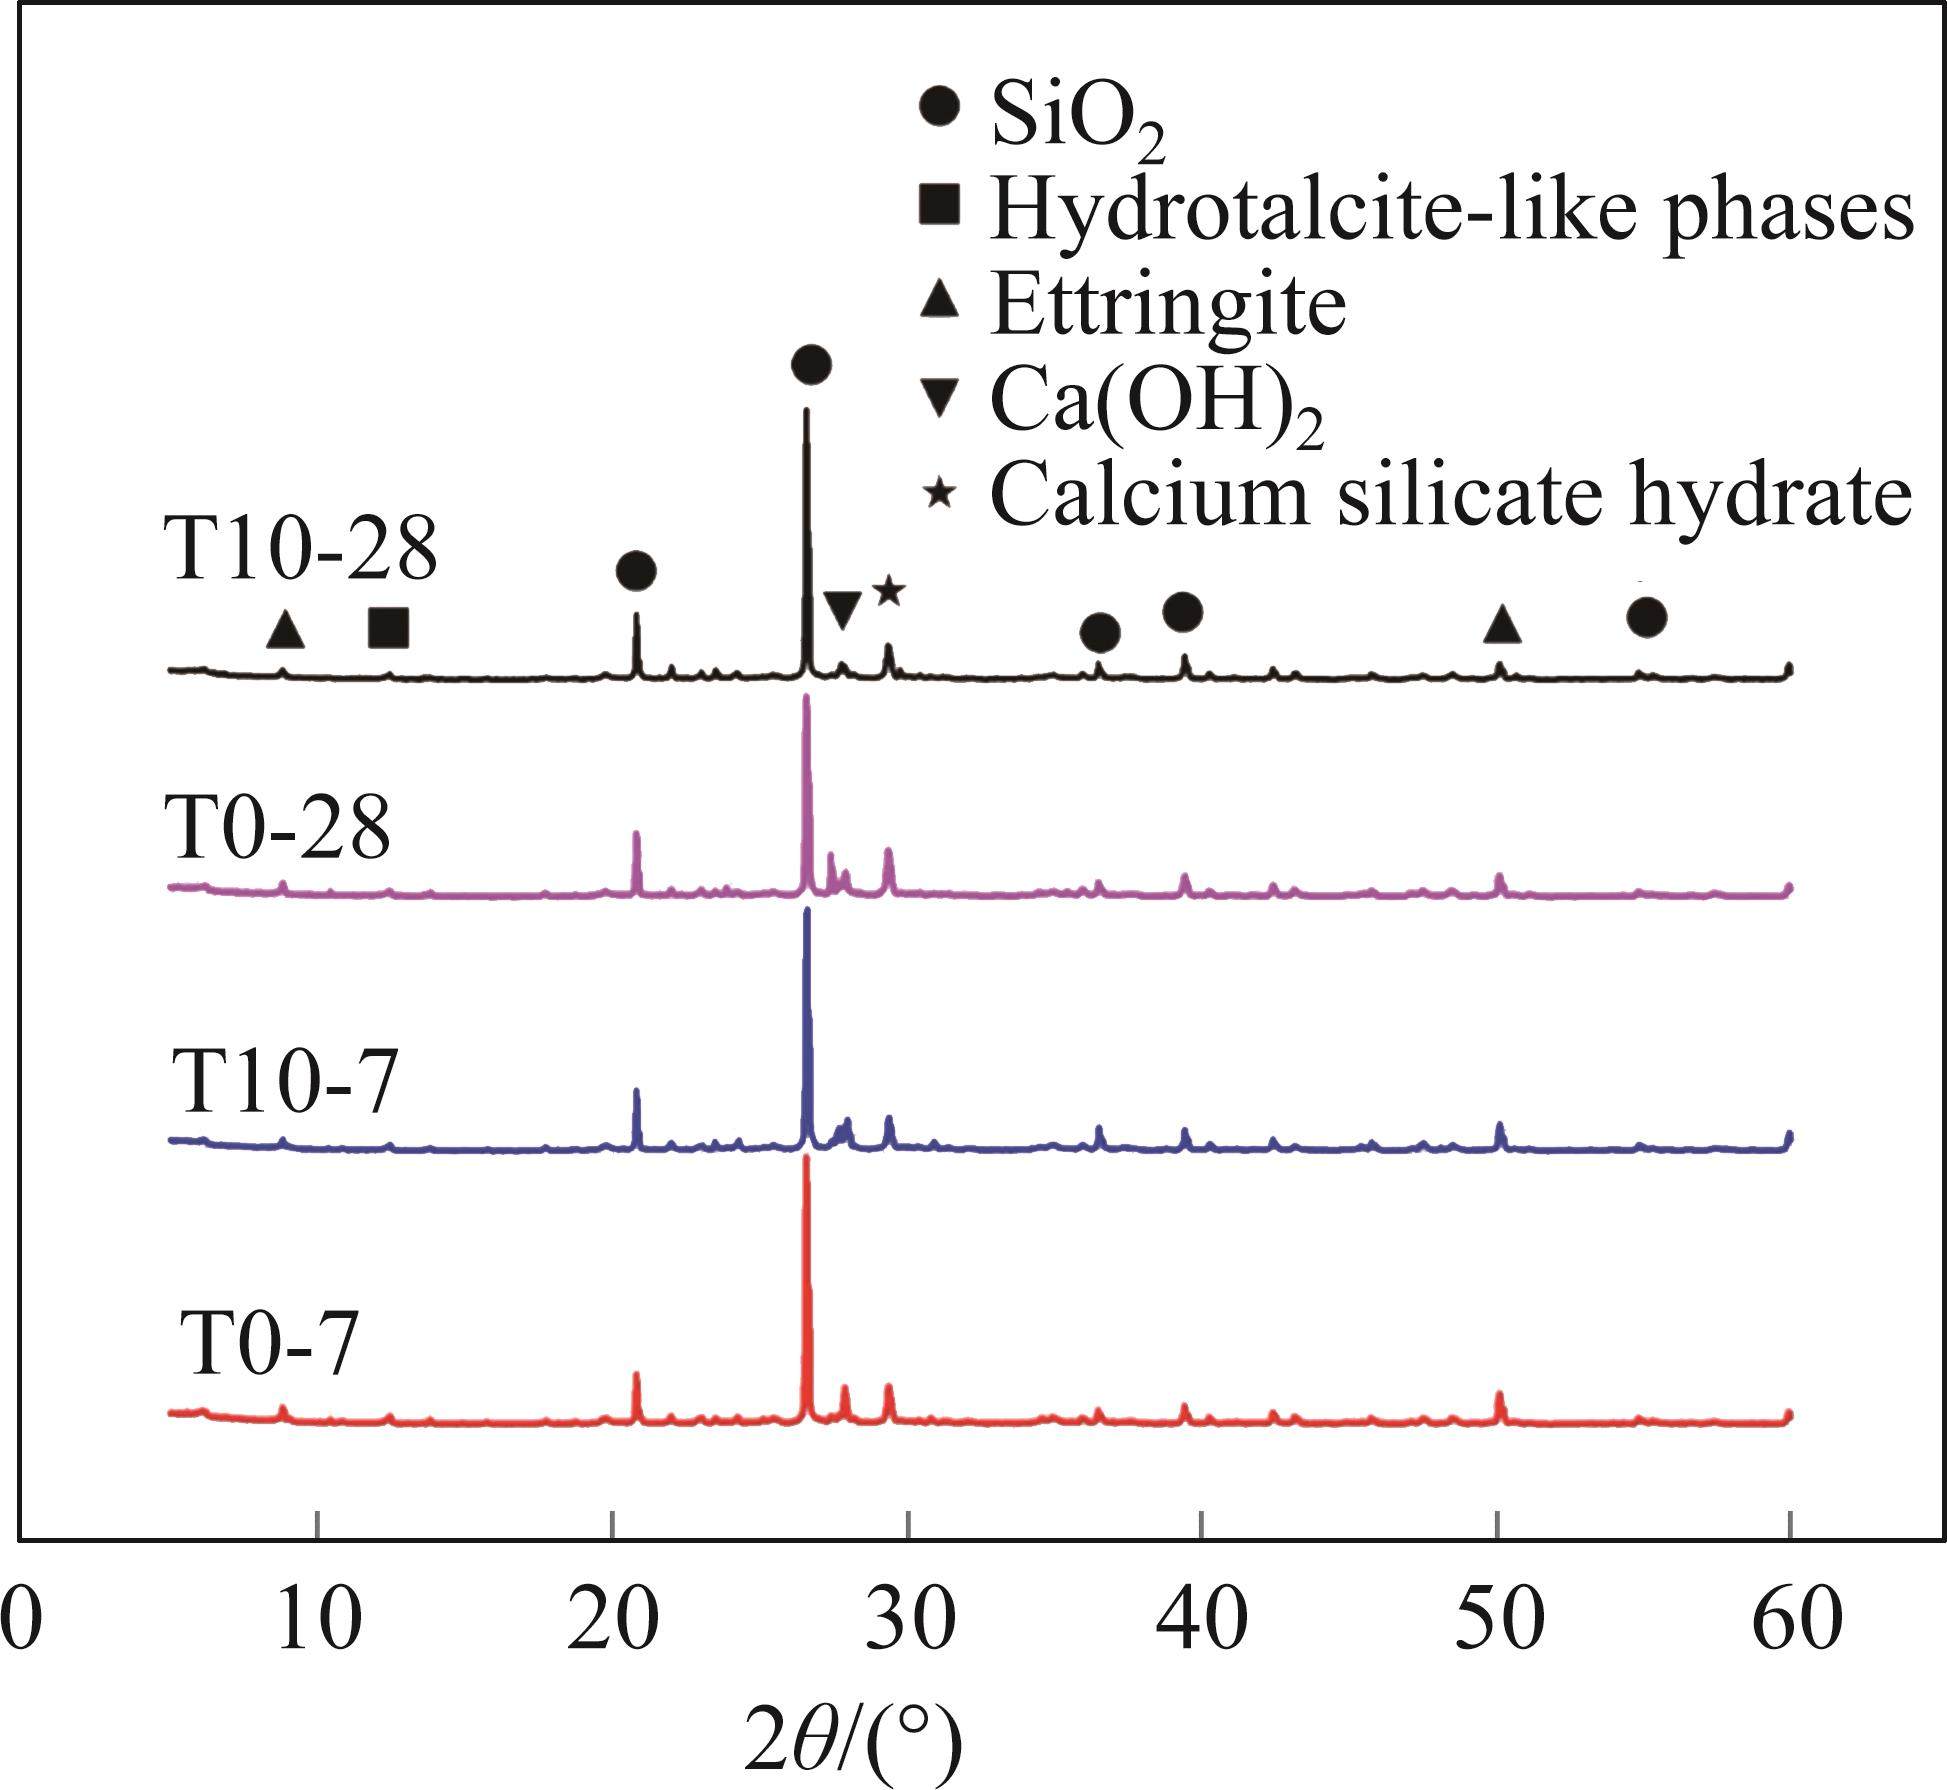
After 7 d of curing, the diffraction peak of AFt (2θ=9.1°) in group T10 was smaller than that in group T0. The diffraction peak of C-H (2θ=28.8°) was larger than that in group T0. After 28 d of curing, hydration products such as C-S-H and AFt (2θ=49.5°) in group T10 increased. It is noteworthy that the C-H content of group T10 significantly decreased after 28 d of curing. This indicates that silica fume can consume the C-H produced during hydration. Volcanic ash materials are known to have secondary reactions with C-H to generate new products in an alkaline environment [36, 37]. In addition to consuming C-H, the addition of silica fume accelerated the hydration reaction [38].
Similarly, the backfills in groups T0 and T10 at different curing times were subjected to SEM tests to observe the hydration products and microscopic morphological changes. The SEM images of the backfill are shown in Figure 7. Two SEM images were taken for each ratio in the figure, with magnifications of 1000× and 3000×, respectively. The images with 3000× magnification were binarized to facilitate the observation of the pore morphology of the backfill.
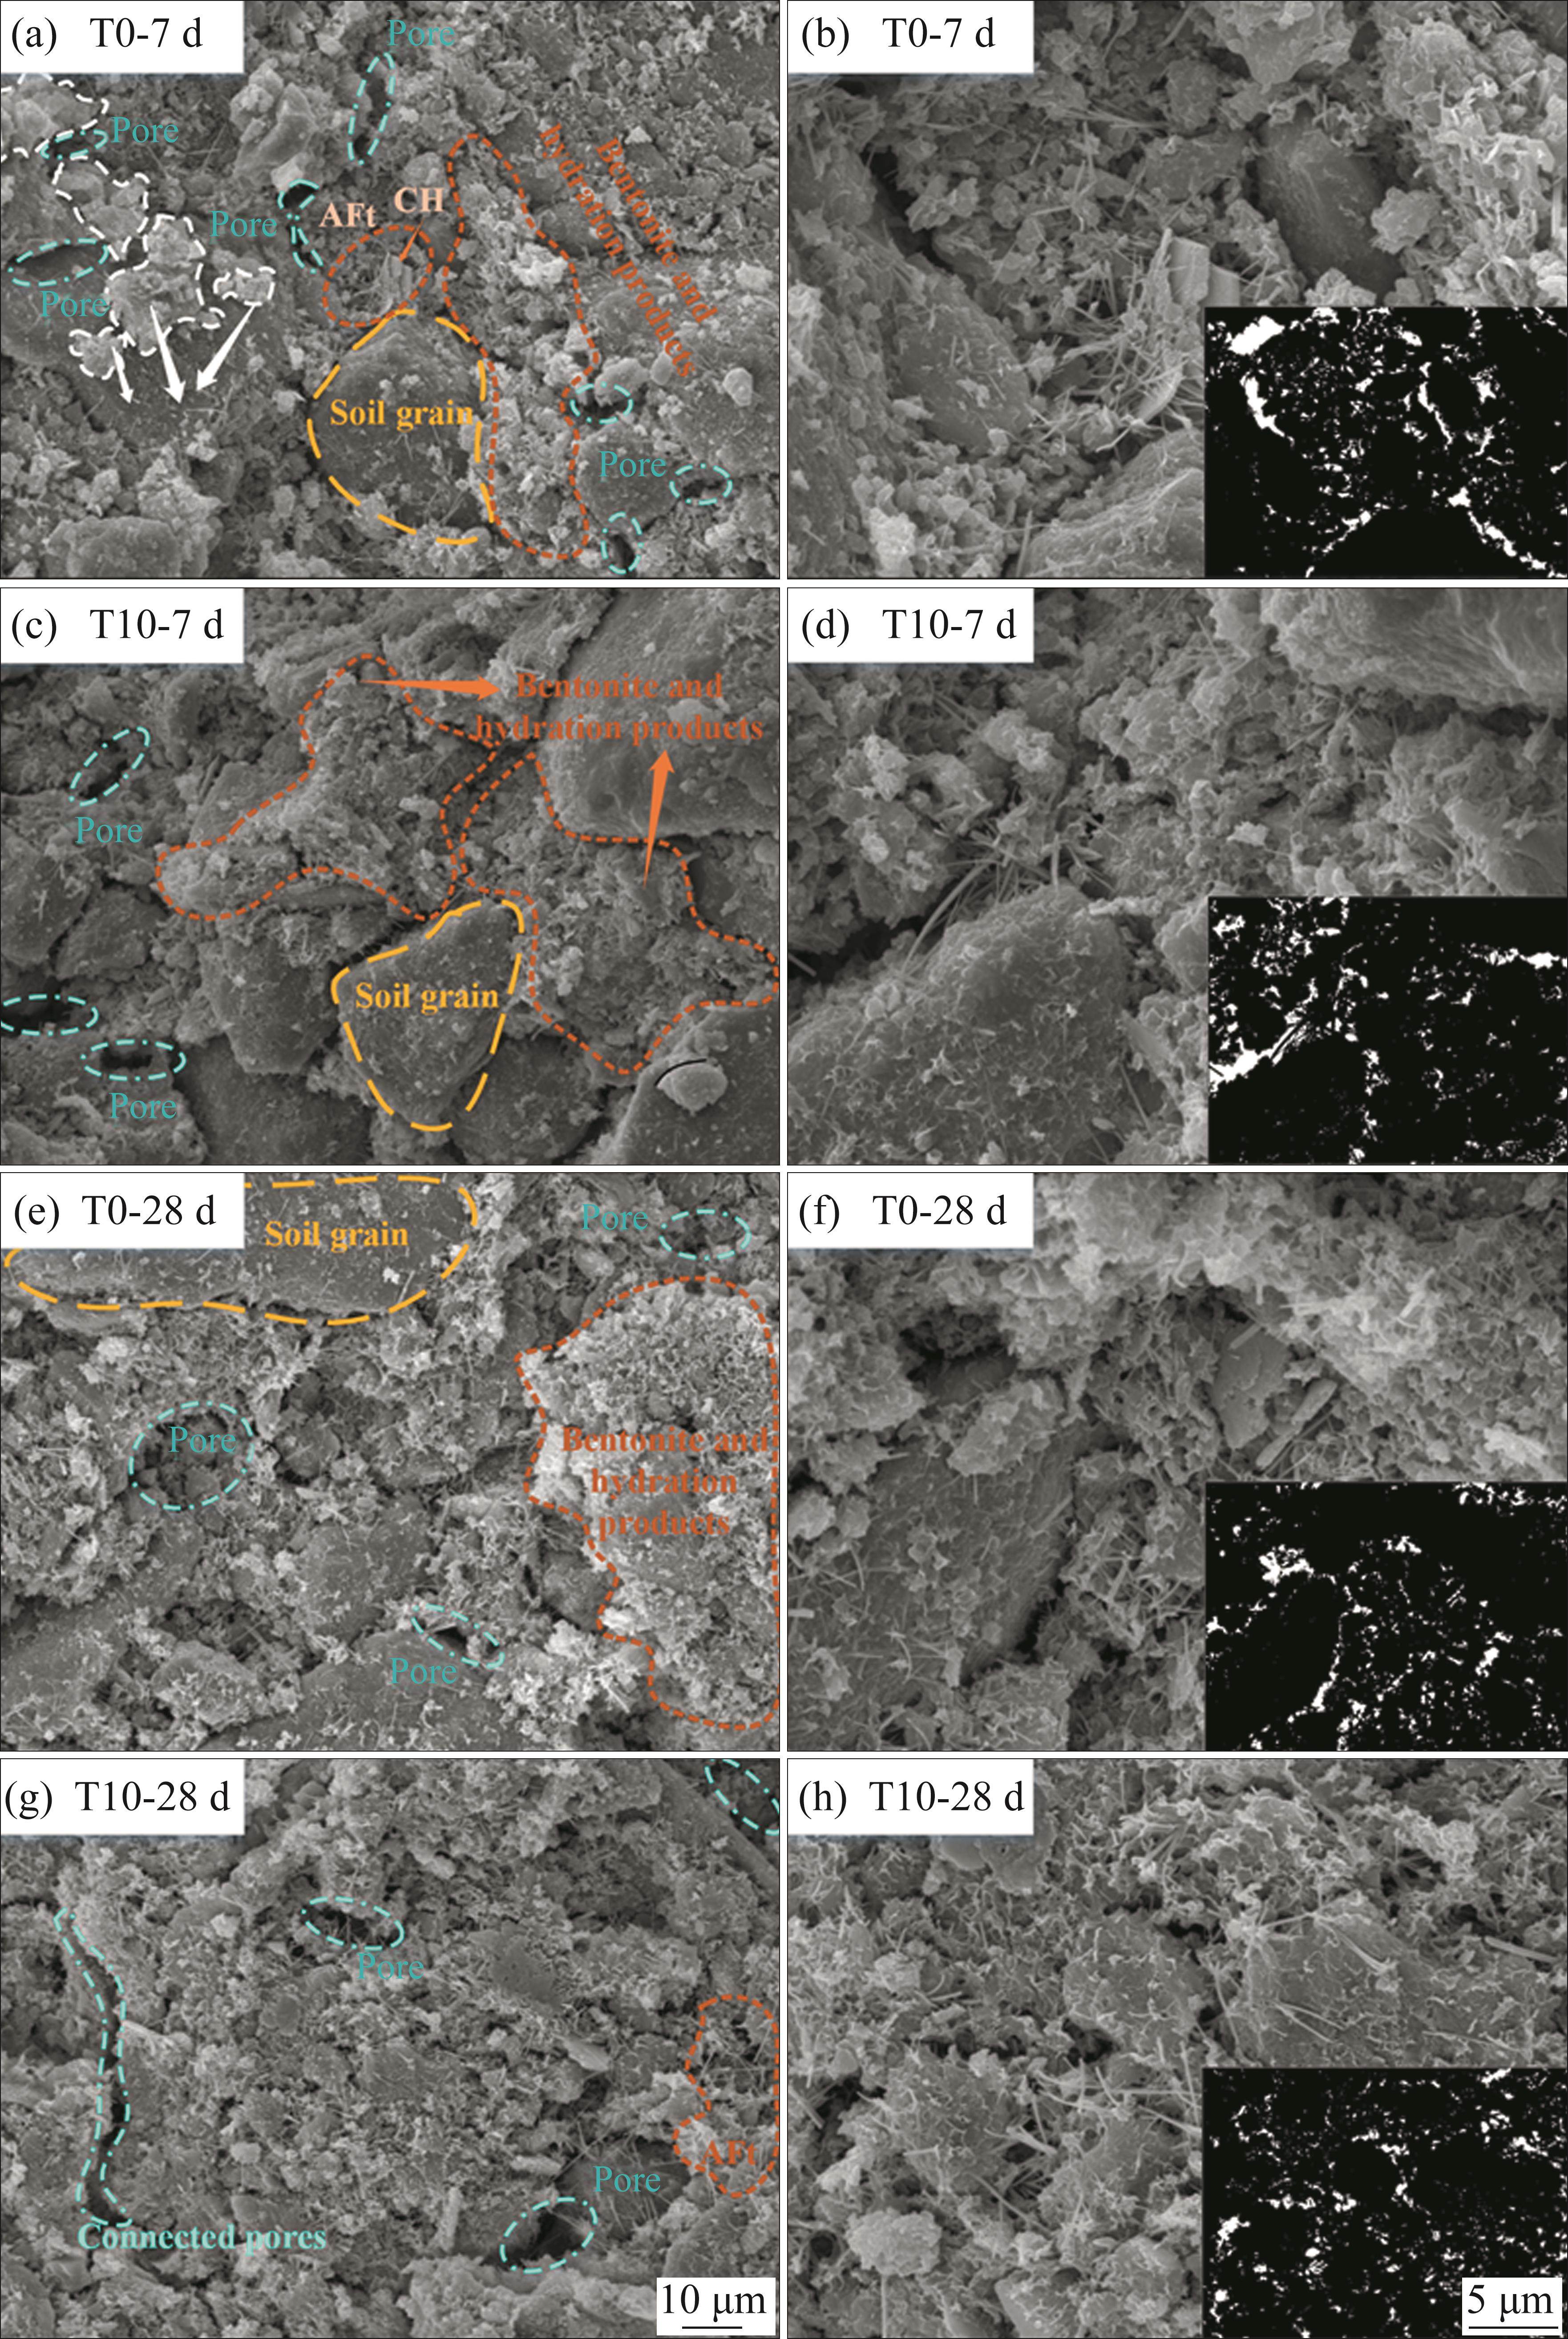
The main components of the SSCB backfill were observed in the SEM images. Figure 7(a) shows that the in-situ soil in the SSCB backfill had clear round particles, and soil particles of different sizes built the backfill skeleton. The figure also shows that the bentonite was attached to the soil particle surface. The bentonite hydrates have obvious curling and smooth characteristics. As the hydration reaction proceeded, needle-like AFt, amorphous C-S-H, and hexagonal platelet-like C-H hydration products were observed, as shown in Figure 7(e). Many flocculent bentonites and needle-like hydration products filled the crevices of soil particles and enhanced the inter-skeleton bonding while densifying the material structure.
Figures 7(a)-(d) show the microscopic SEM images and apparent pore characteristics of groups T0 and T10 after 7 d of curing. The microscopic morphology indicates that the small amount of plate-like C-H was observed in group T0, which was not present in group T10. The pore structure of group T0 was looser with large and interconnected pores. Group T10 had a similar pore structure distribution as that of group T0, but with a slightly higher number of small pores. The overall structure was also denser than that of group T0.
Figures 7(e)-(h) show the microscopic SEM images of groups T0 and T10 after 28 d of curing. The figure indicates that the number of hydration products in groups T0 and T10 were significantly higher compared with those after 7 d of curing. The pores were loaded with a lot of AFt and C-H-S gels, and they crossed each other and were closely connected, improving the density of the backfill. The number of large and connected pores in group T0 slightly decreased, the connected pores in group T10 gradually disappeared, and the big pores were filled with small pores. This indicates that the effect of silica fume on the backfill was more pronounced in the middle and late stages of curing, which is the same as the macroscopic performance of the backfill. It was determined that the changes in the microscopic morphology and pore structure of the SSCB backfill were the main factors that led to the increased strength and reduced permeability of the backfill.
4 Analysis and discussion
4.1 Relationship between macroscopic characteristics and porosity
4.1.1 Relationship between strength and porosity
The porosity and UCS values at various curing periods were fitted in this work to depict the connection between the porosity and UCS of the SSCB backfill, as shown in Figure 8.
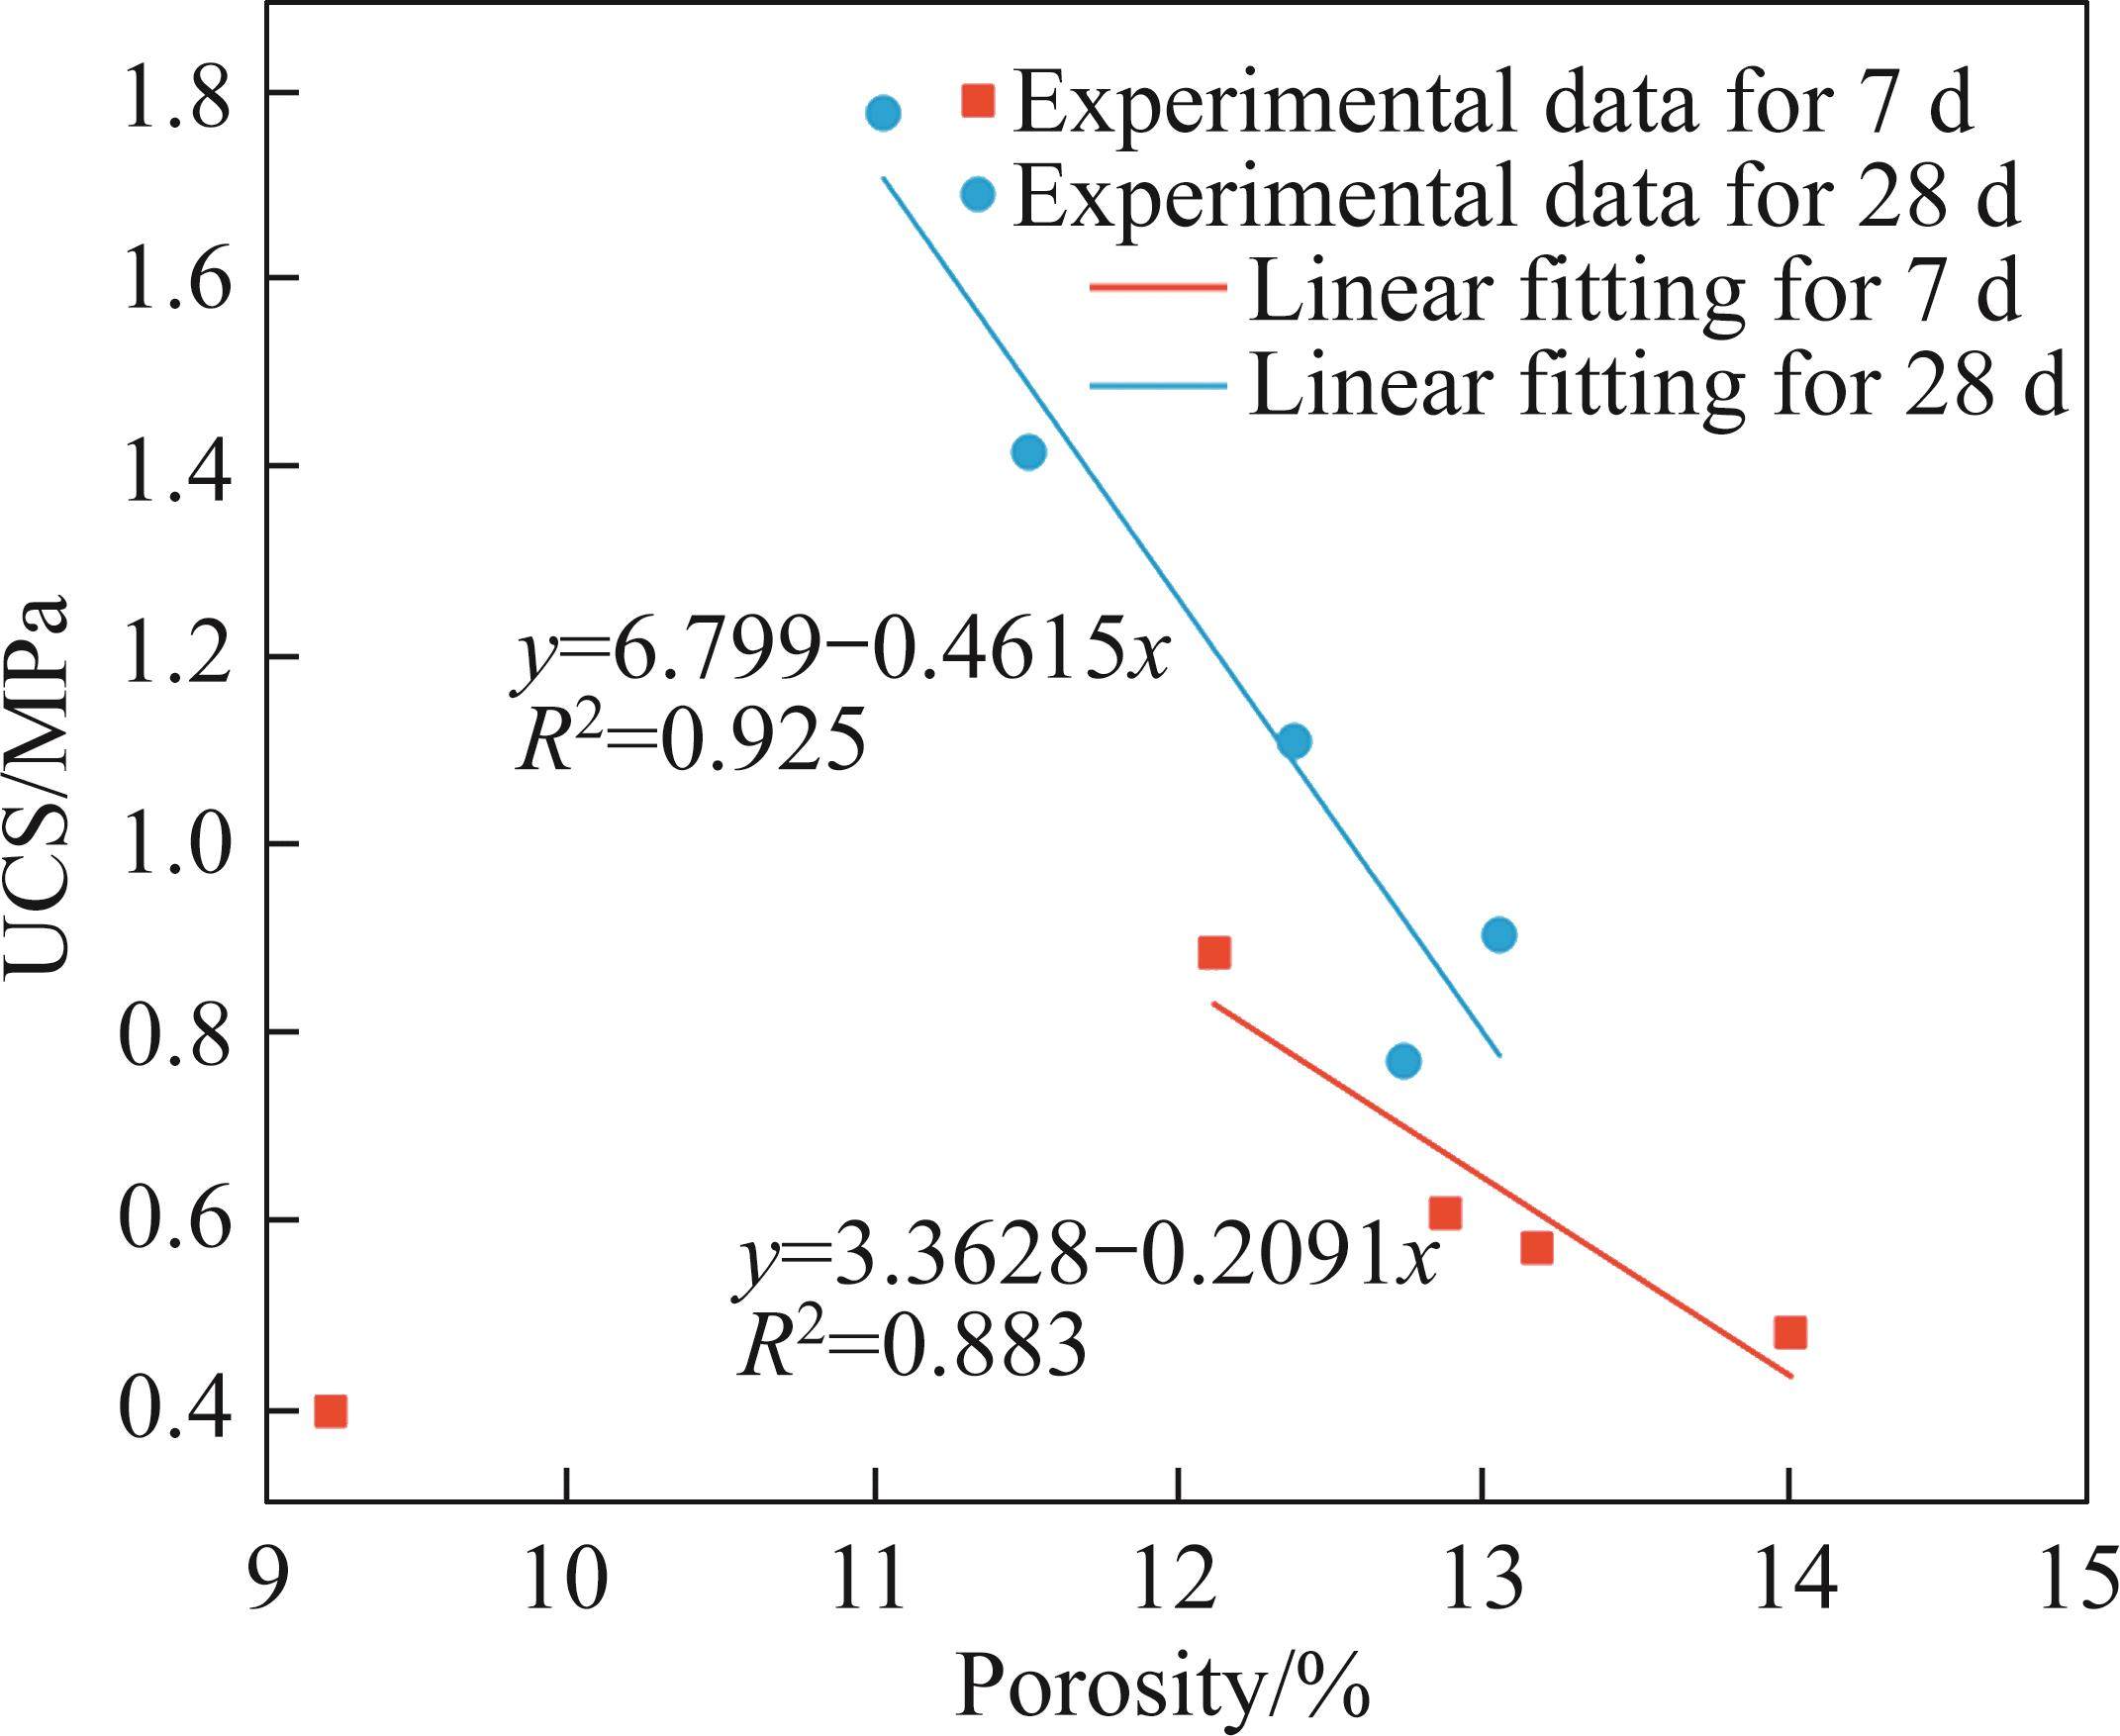
UCS of SSCB backfill inversely correlated with porosity across curing time. As illustrated in Figure 8, the UCS of the backfill at 28 d demonstrates a pronounced decline with increasing porosity, indicating that in the early stage of backfill curing, the hydration reaction is incomplete, and the addition of silica fume could fill the pores. However, the bonding force between the backfill skeleton particles did not increase, and the contribution to the UCS was insignificant. With the increase in the curing time, the addition of silica fume promoted the hydration reaction and enhanced the bonding force between the skeletons while filling the pores, which improved the UCS of the backfill at a later stage.
4.1.2 Relationship between permeability and porosity
Figure 9 depicts the connection between the porosity and permeability coefficient of the SSCB backfill. As indicated by the figure, the permeability coefficient of the SSCB backfill decreased with decreasing porosity at different curing times. The slope of the fitted line was significantly greater after 7 d than that after 28 d of curing. This shows that the inclusion of silica fume reduced the backfill’s porosity and enhanced the pore structure through the influence of fine particles filling them during the early stages of SSCB backfill curing; increased the degree of curvature between pores; and reduced the permeability coefficient. The greater silica fume substitution ratio had a greater effect on the pore structure. The silica fume that filled the pores interacted with C-H to create additional hydration products as the curing period lengthened. A higher silica fume ratio substitution at this stage could induce the hydration reaction to produce more hydration products to fill the pores. However, the improvement in the pore structure was not as significant as in the early stage of curing.
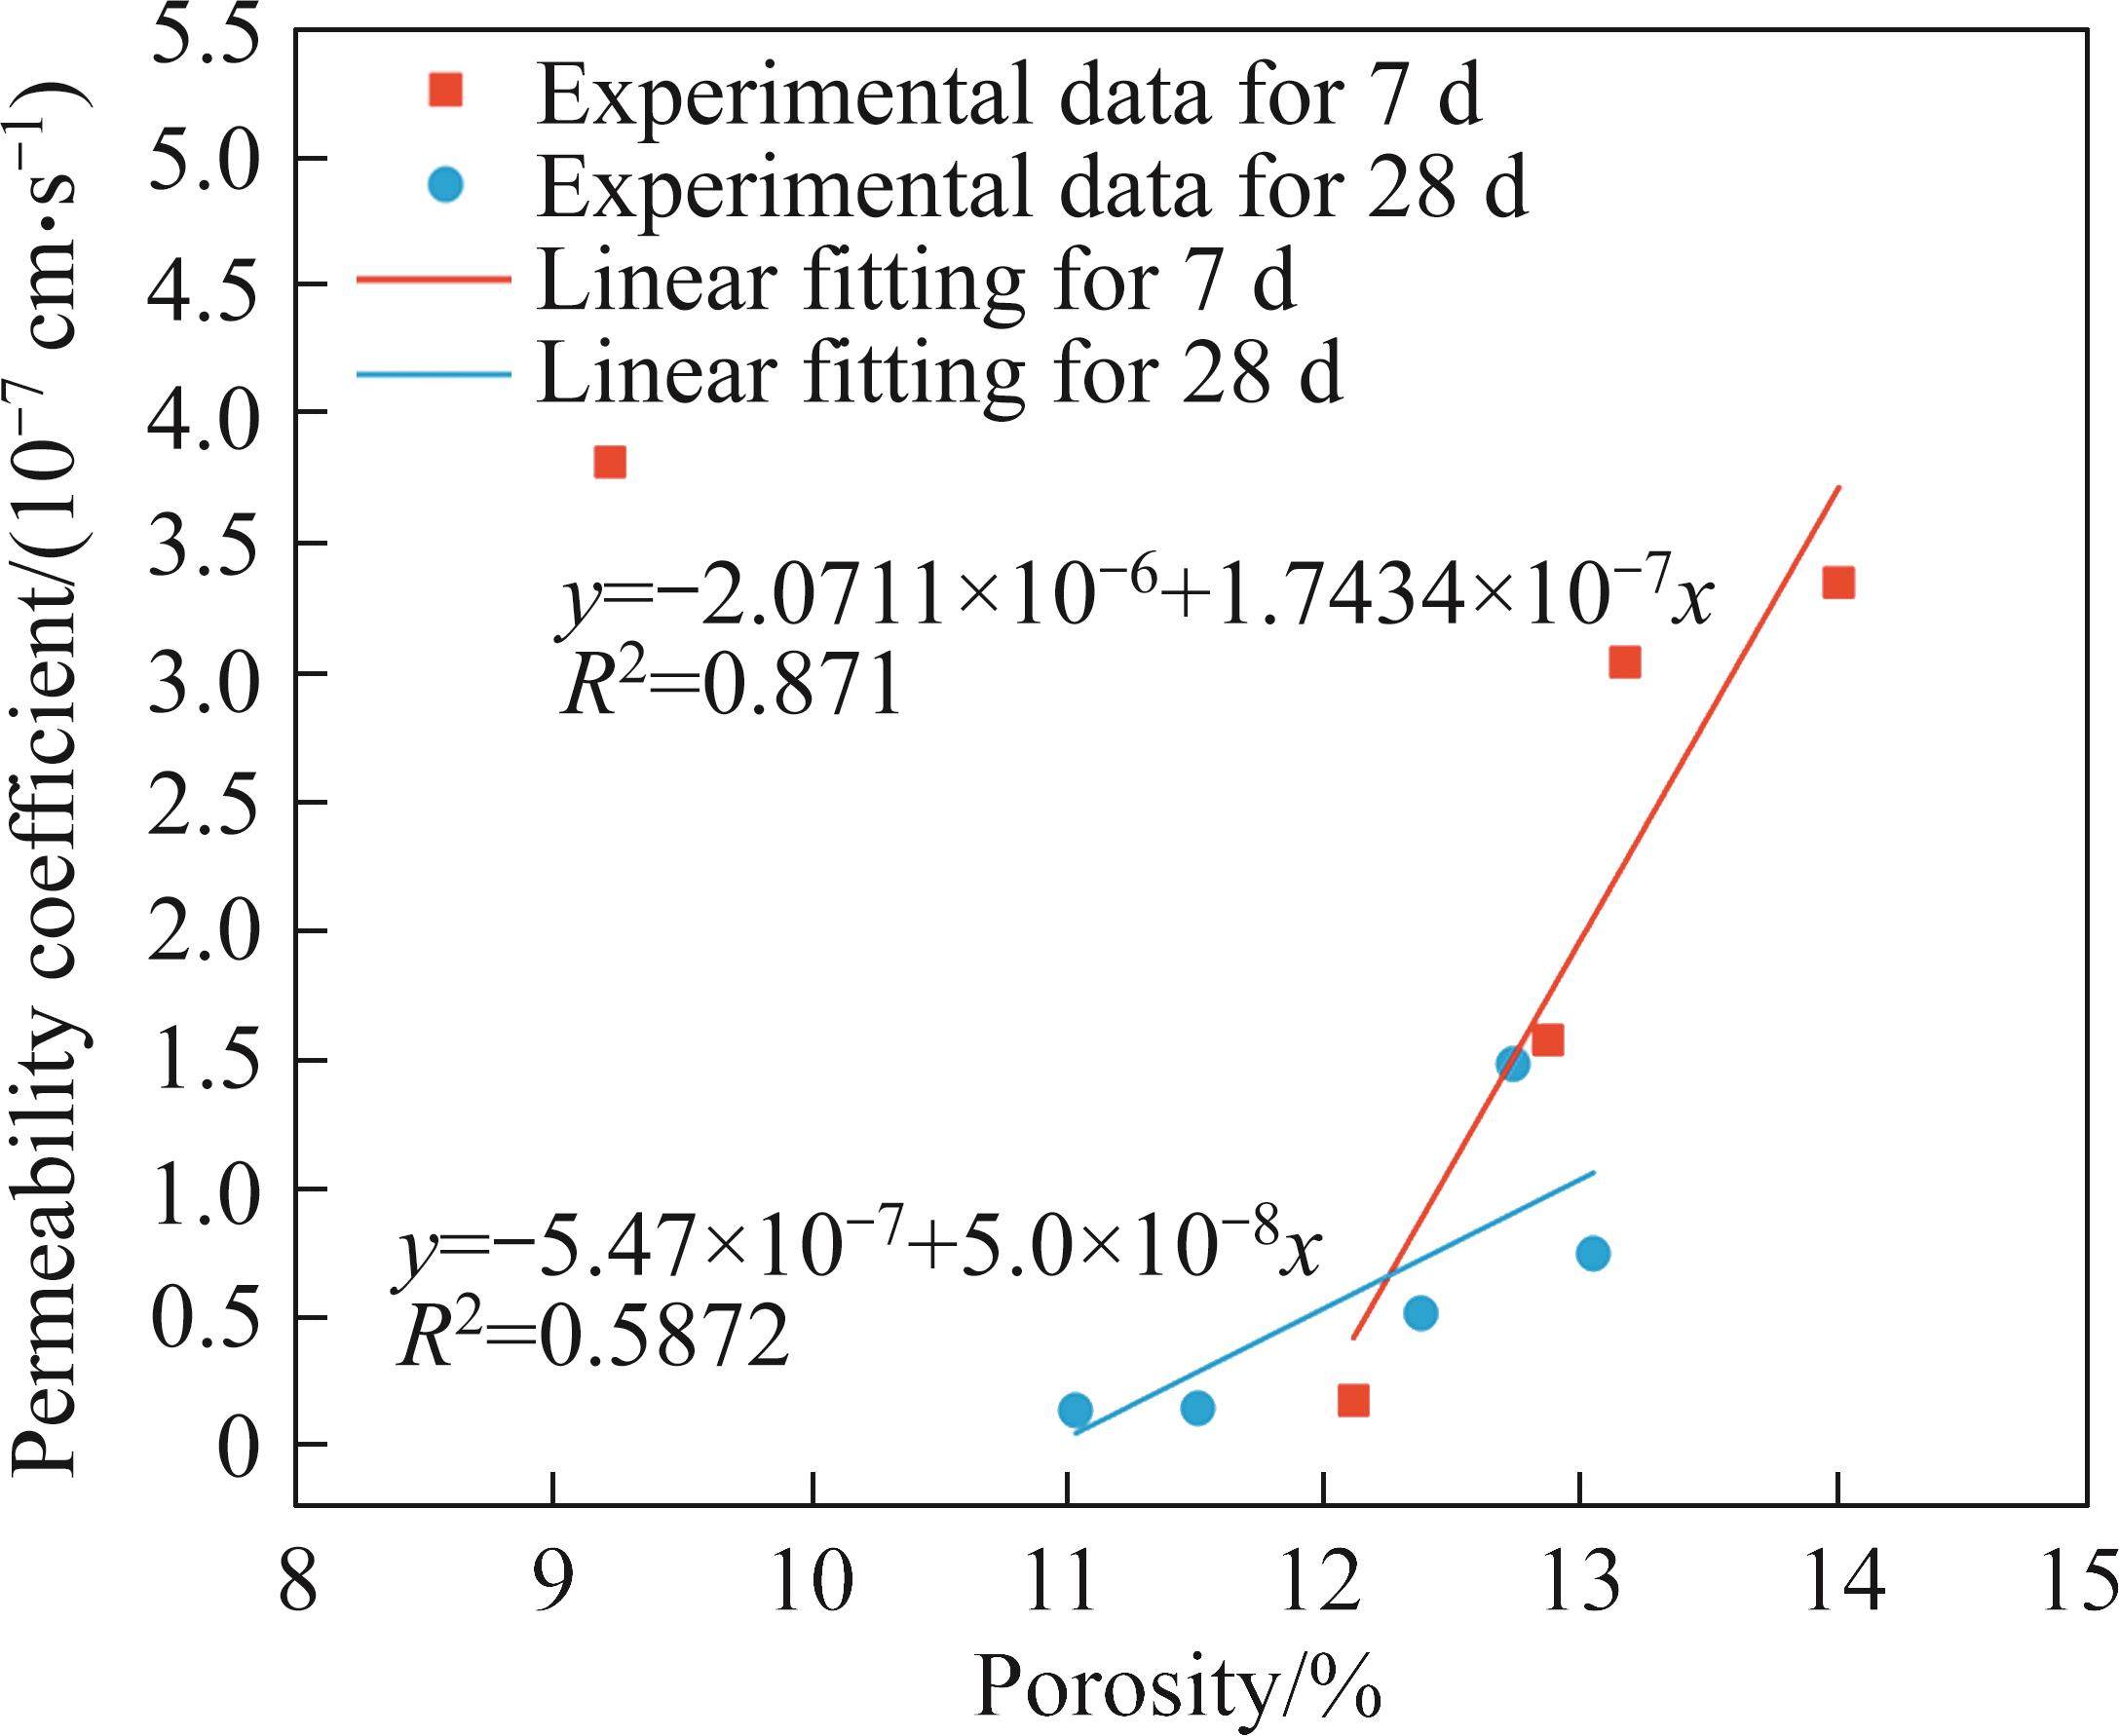
T0 is excluded from the analyses in this subsection because the source of the data for this group is cited.
4.2 Relationship between macroscopic characteristics and fractal dimension
4.2.1 Fractal features
Fractal geometry deals with irregular objects with self-similar characteristics in nature [16, 39]. Therefore, the fractal dimension may be utilized to quantify the pore complexity to further study the impact of various pore sizes on the macroscopic characteristics of the backfill. According to earlier research, the fractal geometry of the SSCB backfill pores may be described as [40]:
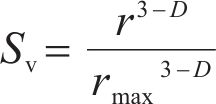
where Sv is the percentage of pores with diameters smaller than r; D is the fractal dimension of the pore; and rmax is the maximum pore radius. It is possible to rewrite Eq. (2) as Eq. (3).
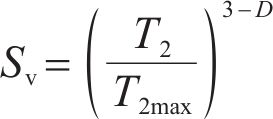
where Sv is the percentage of pore volume with a relaxation time less than T2; T2max is the T2 value corresponding to the maximum pore radius.
We take the logarithm of both sides of Eq. (3) to obtain the expression for the pore fractal dimension of the SSCB backfill as:

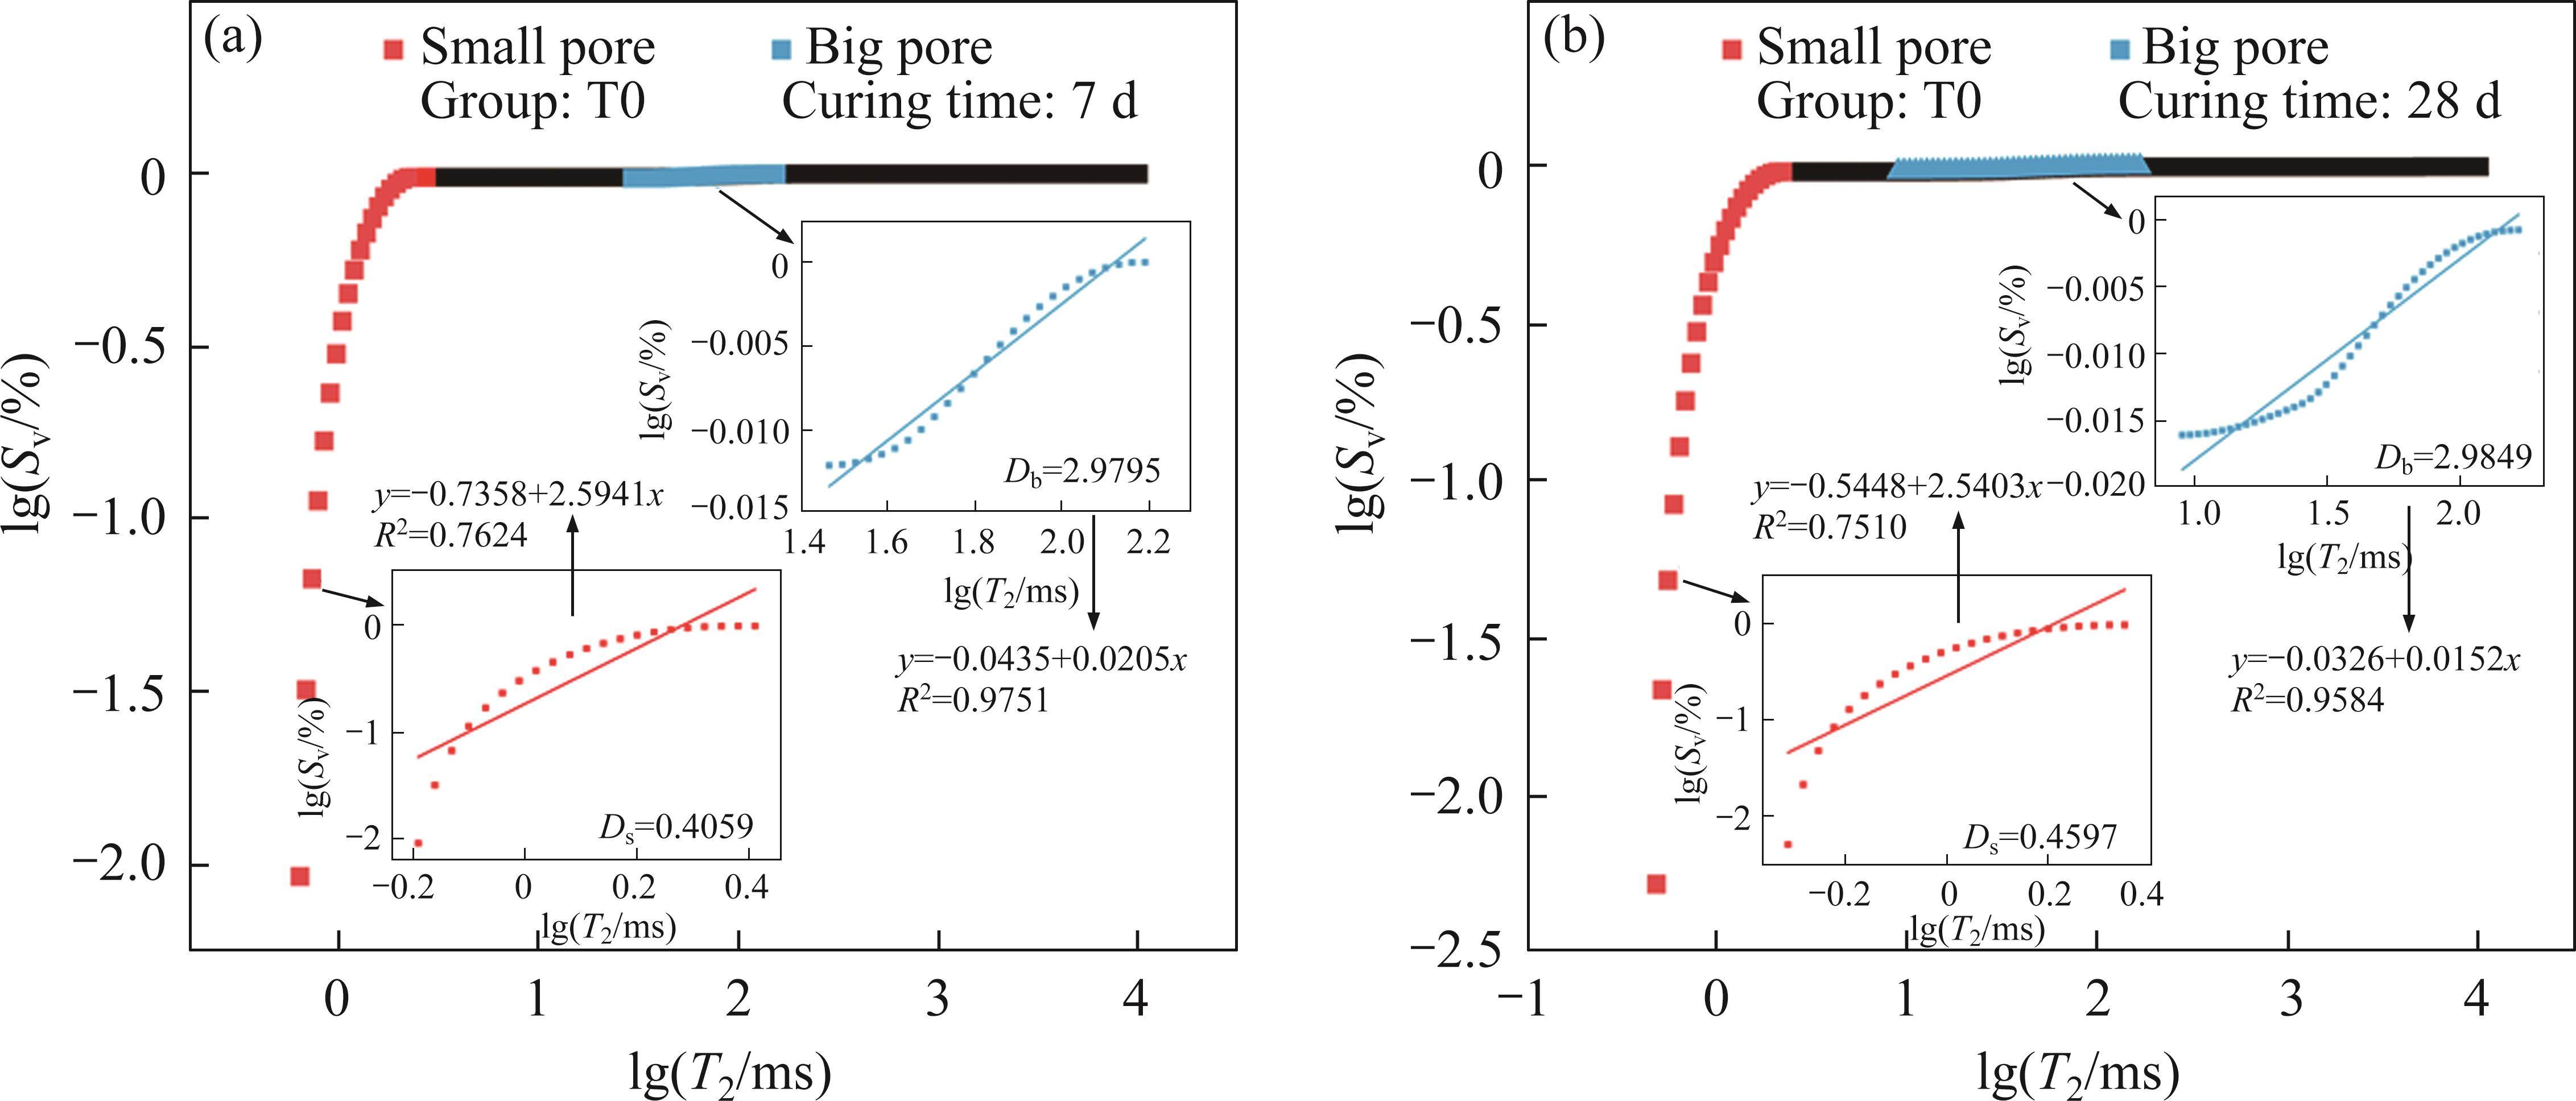
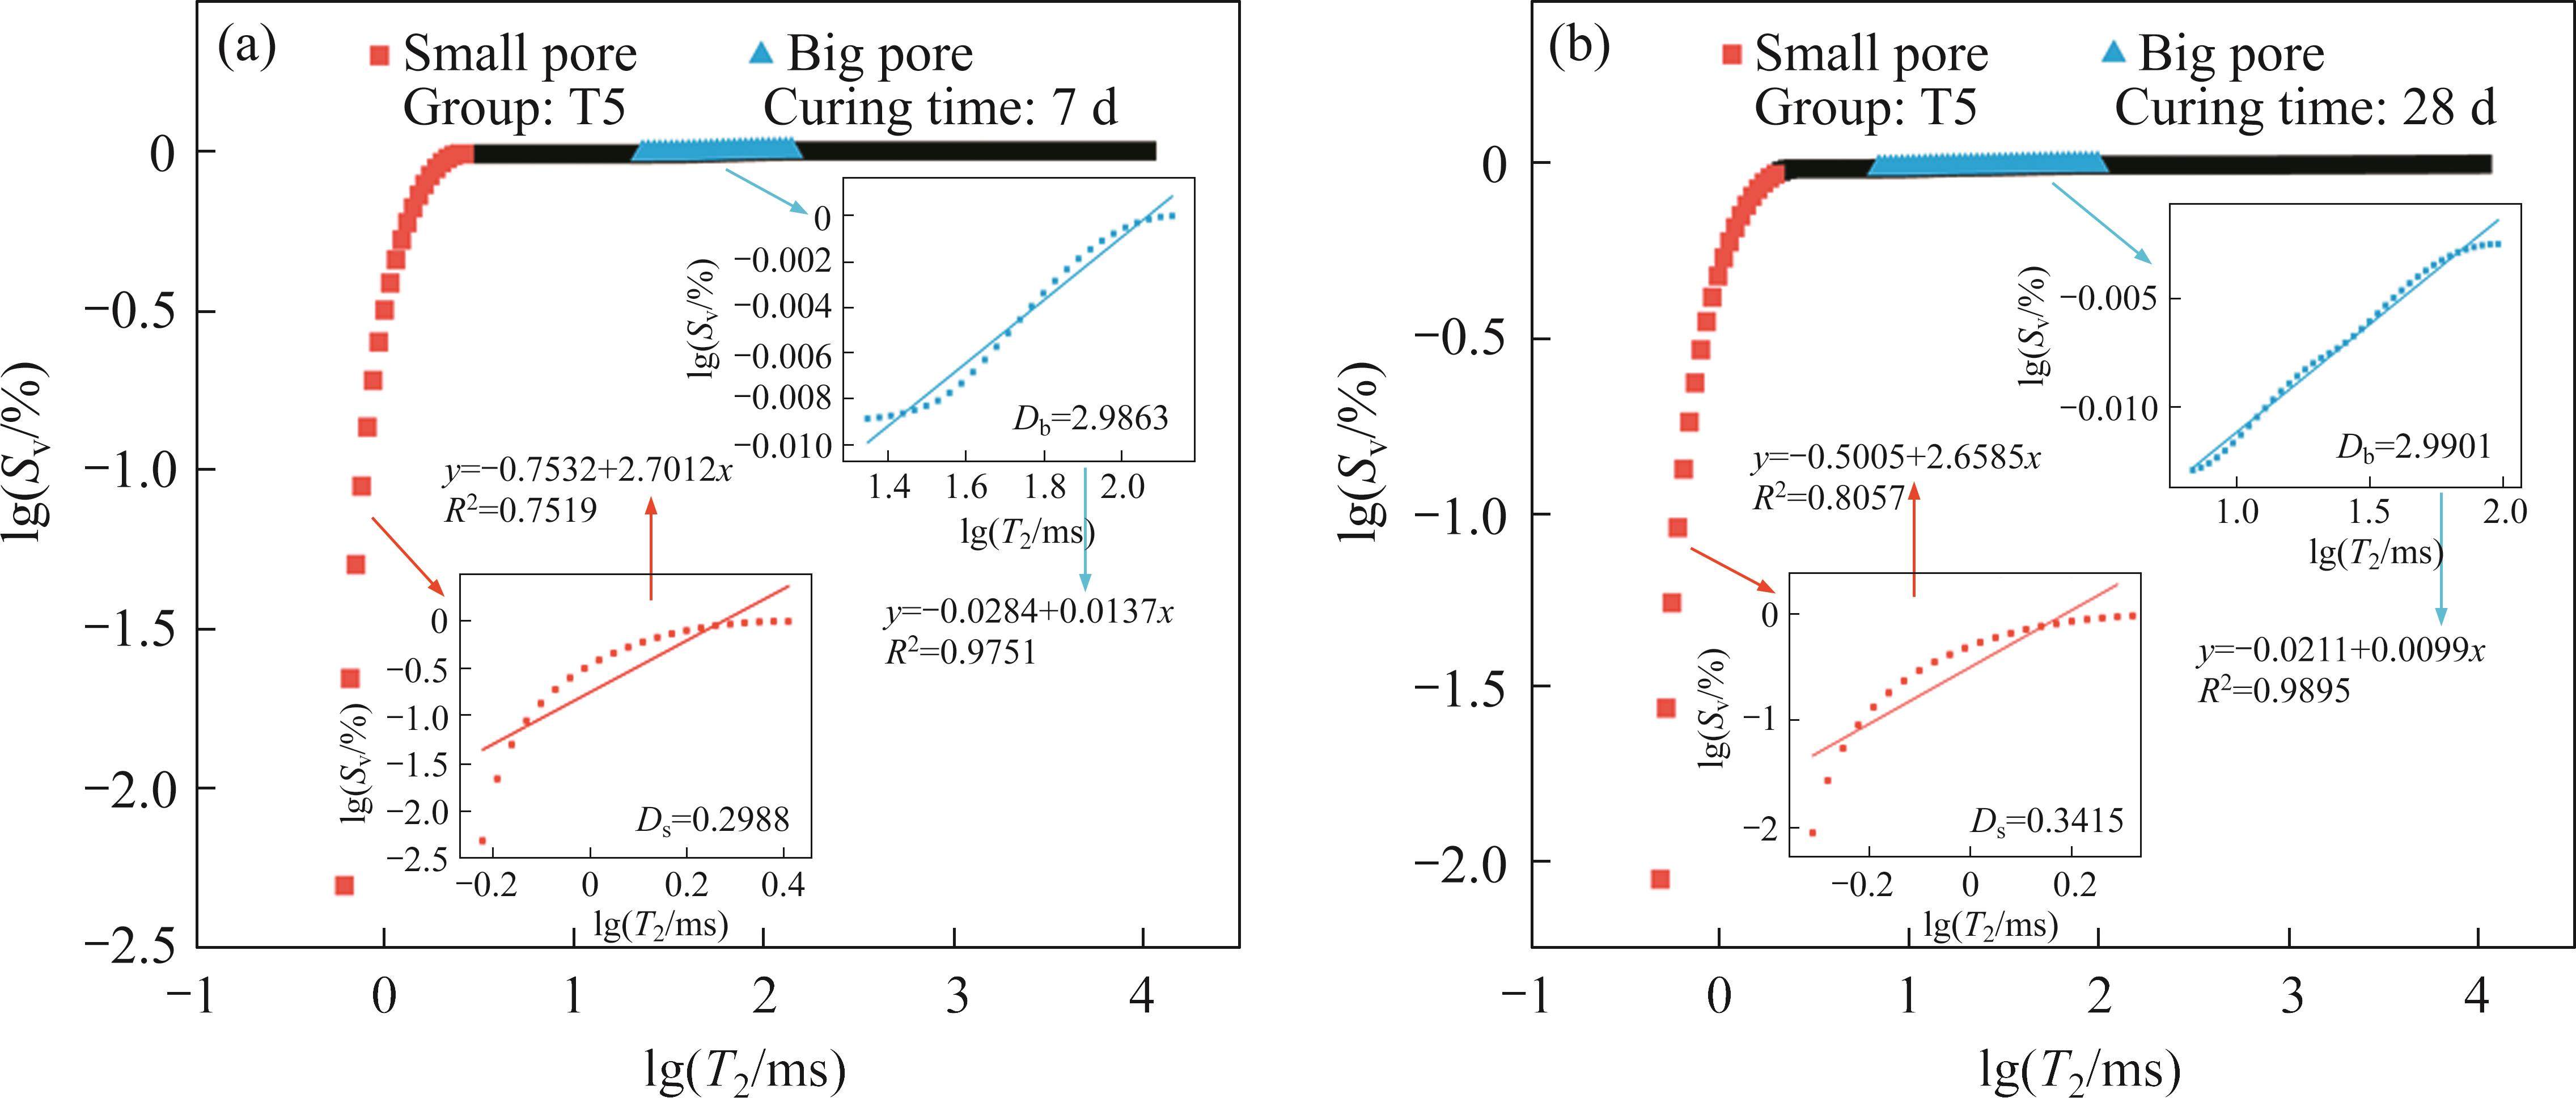
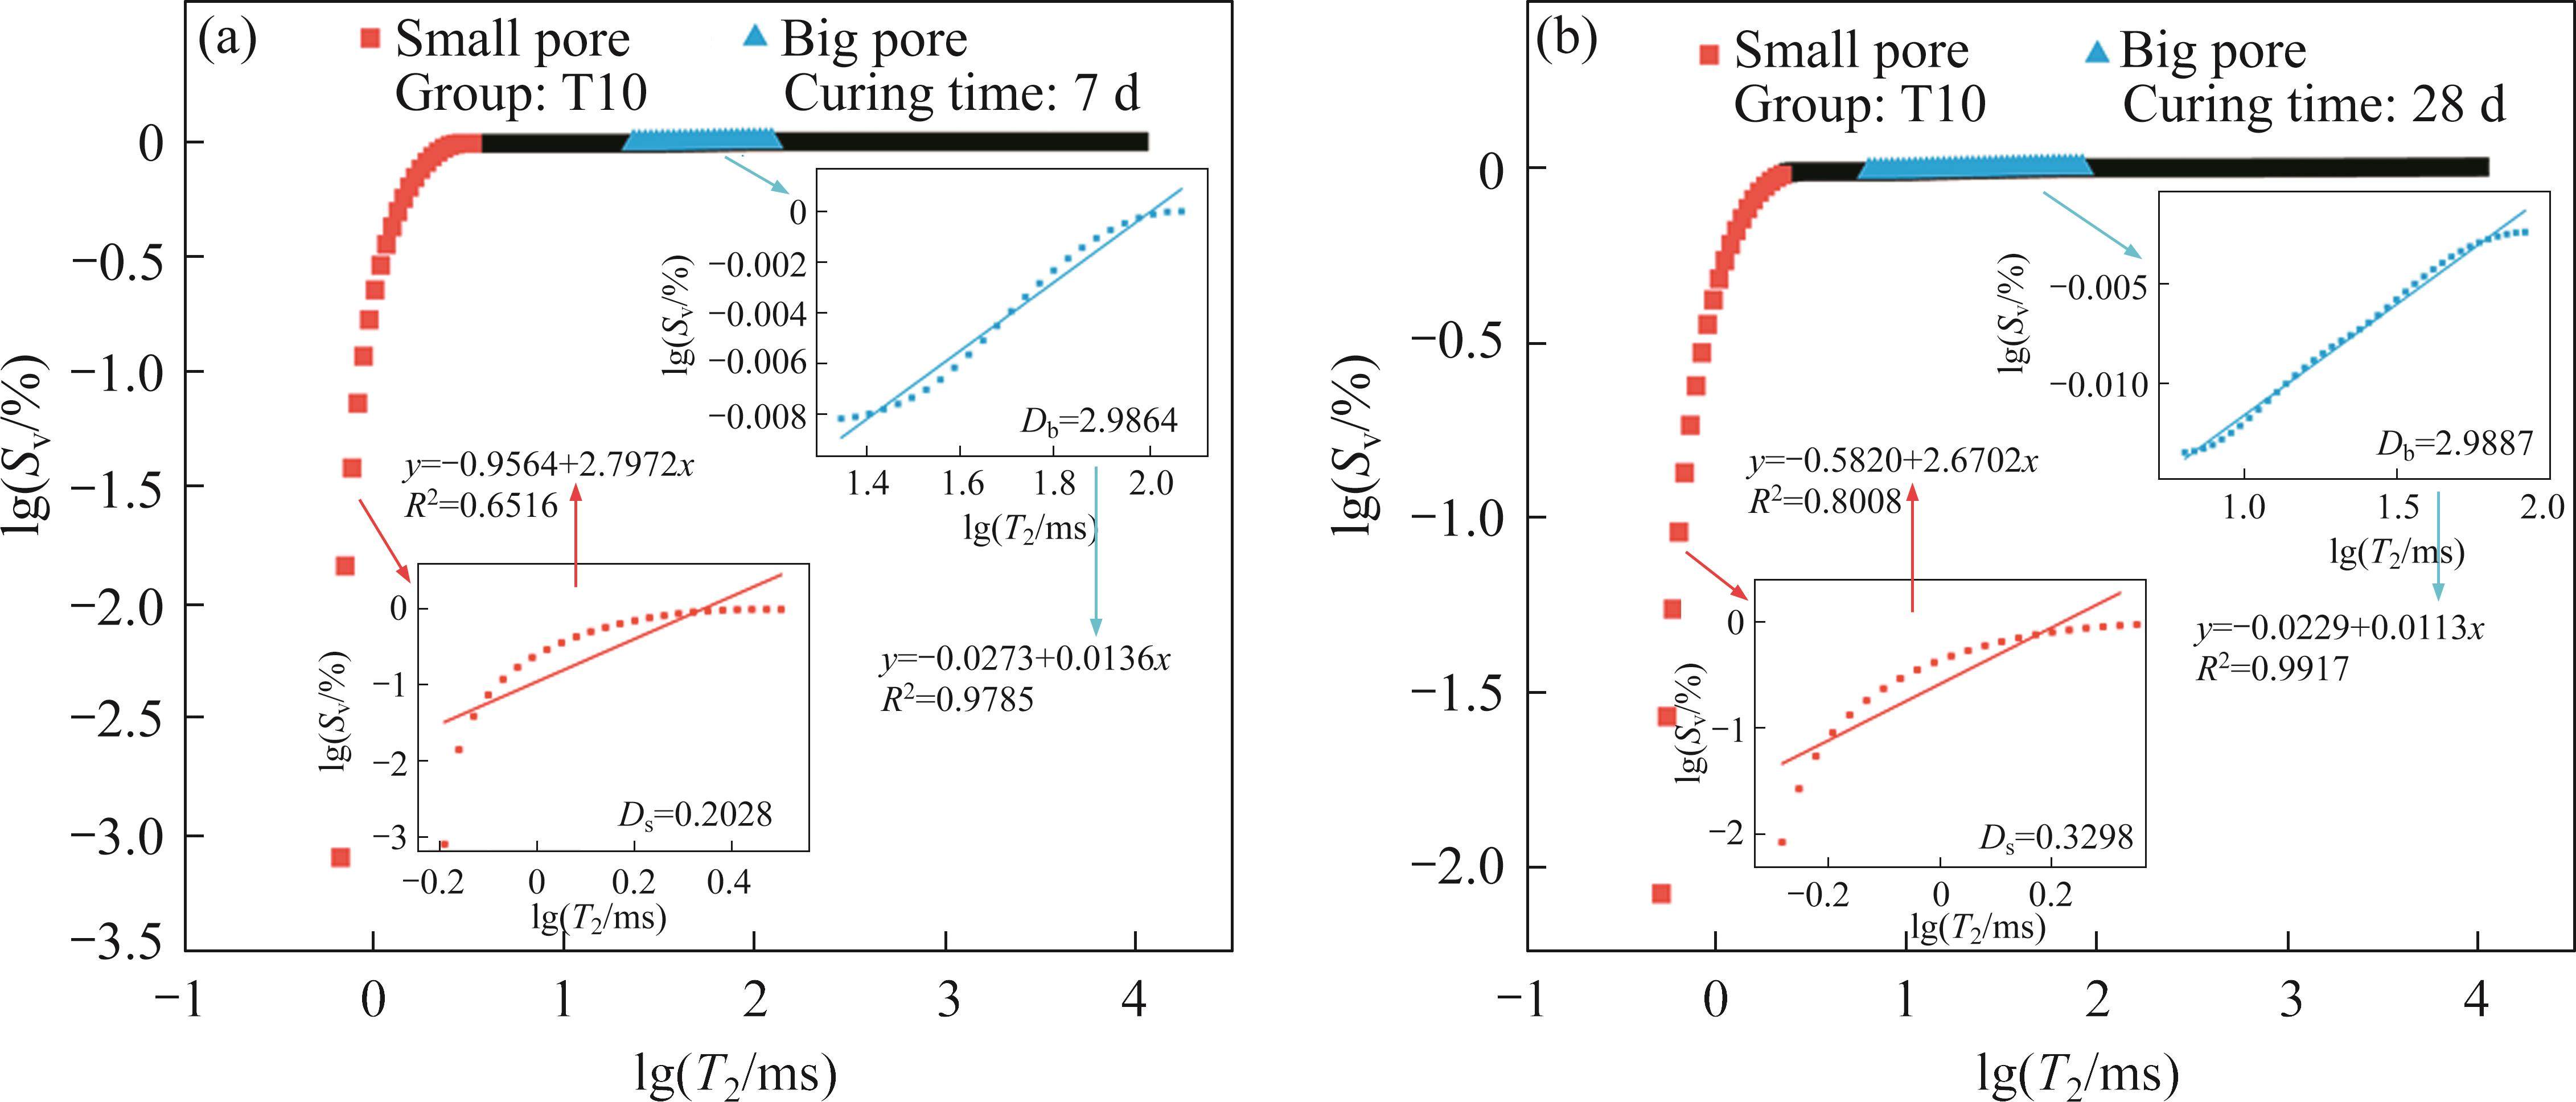
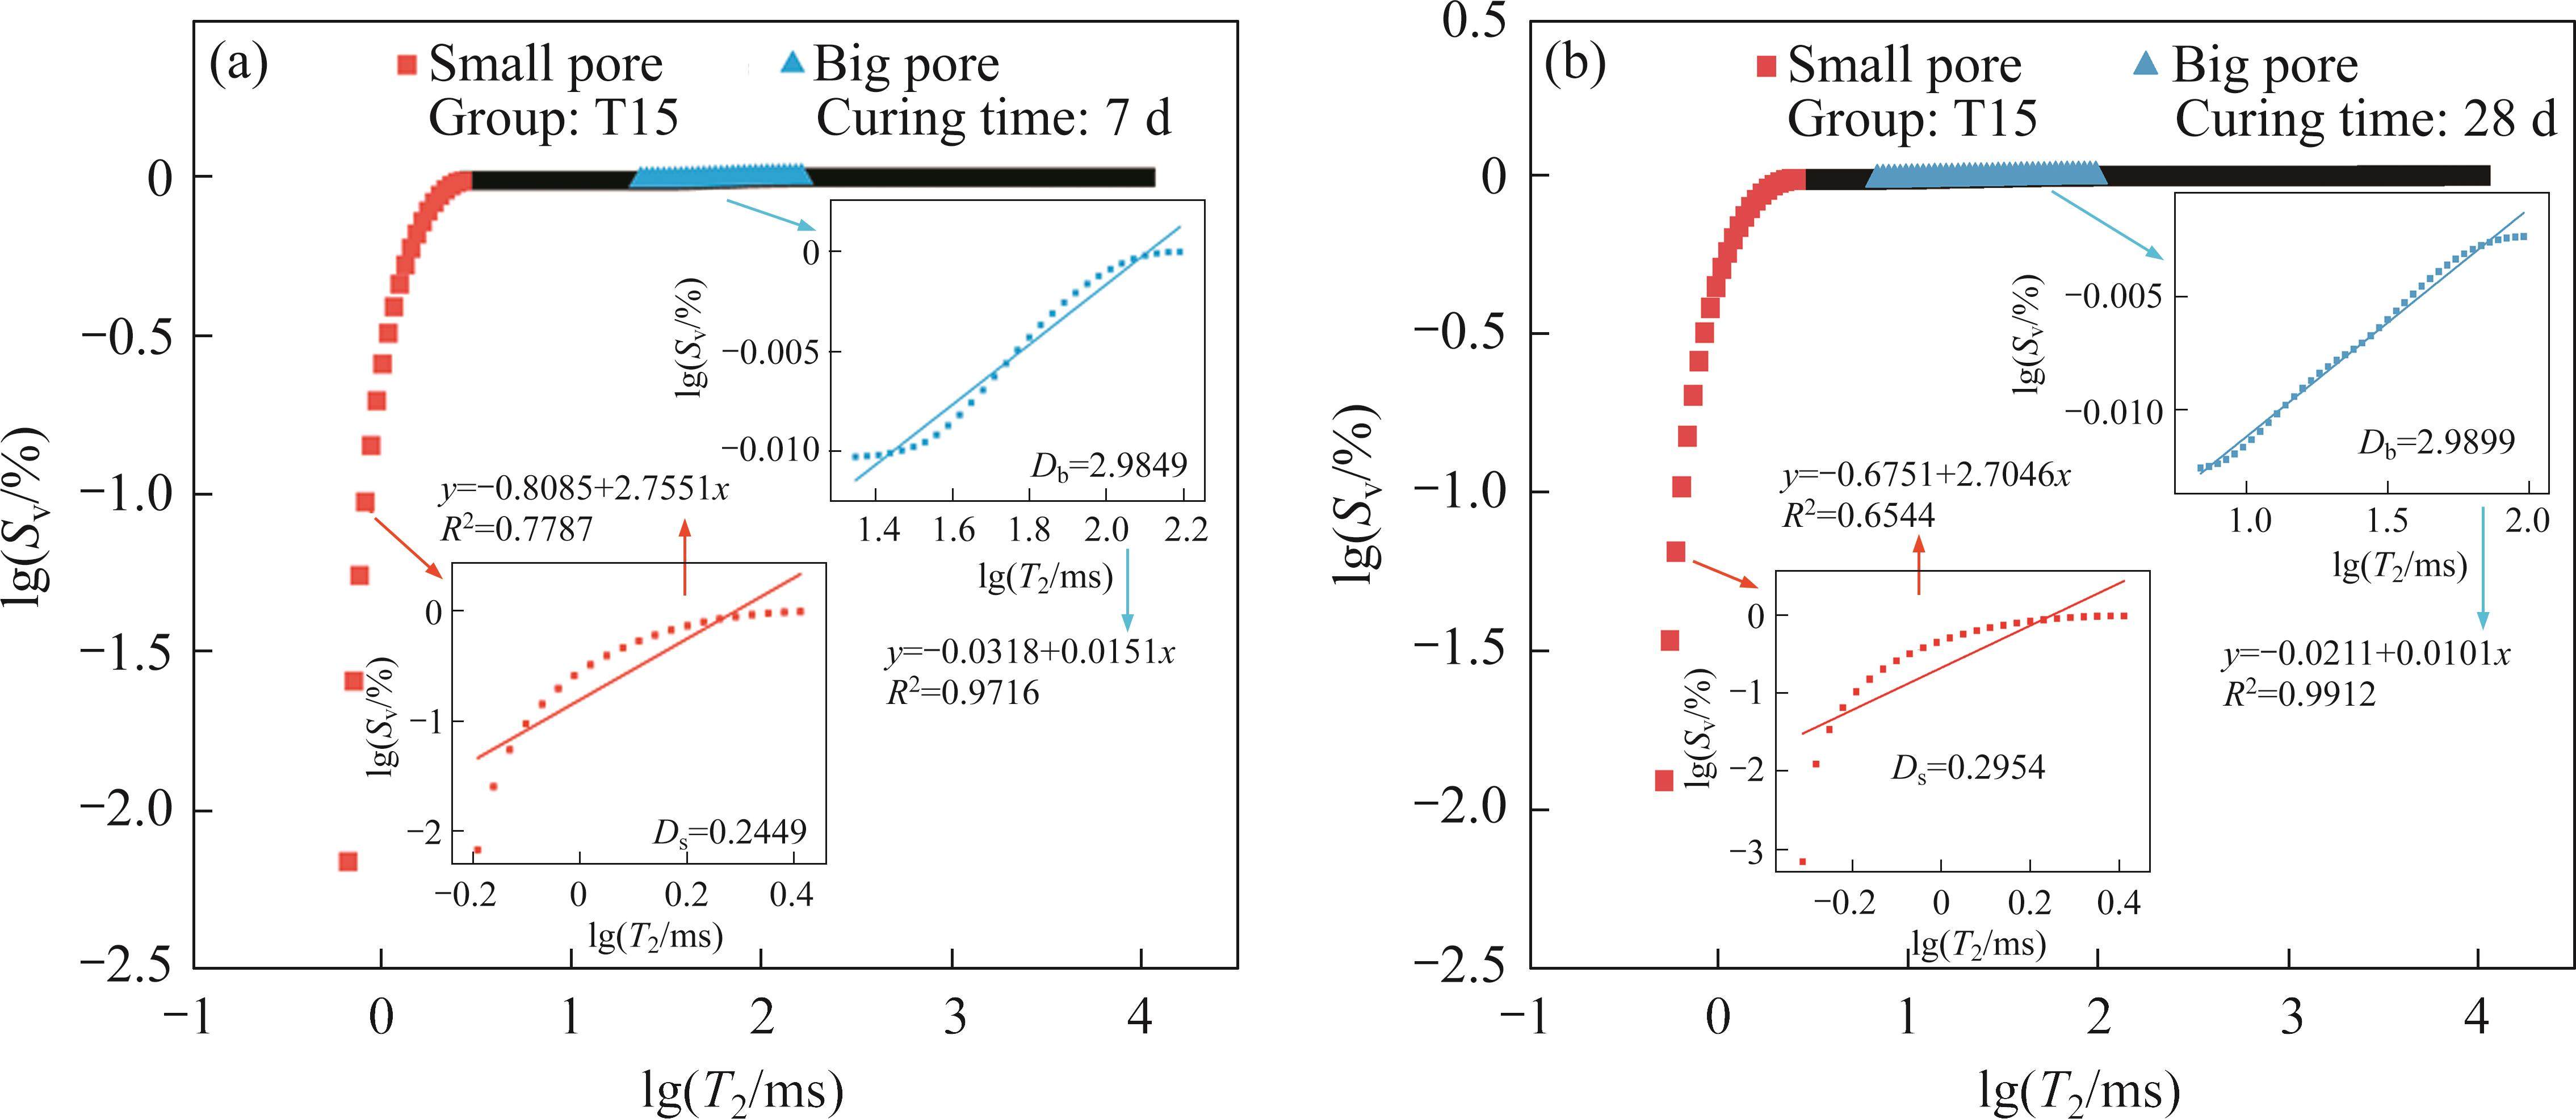
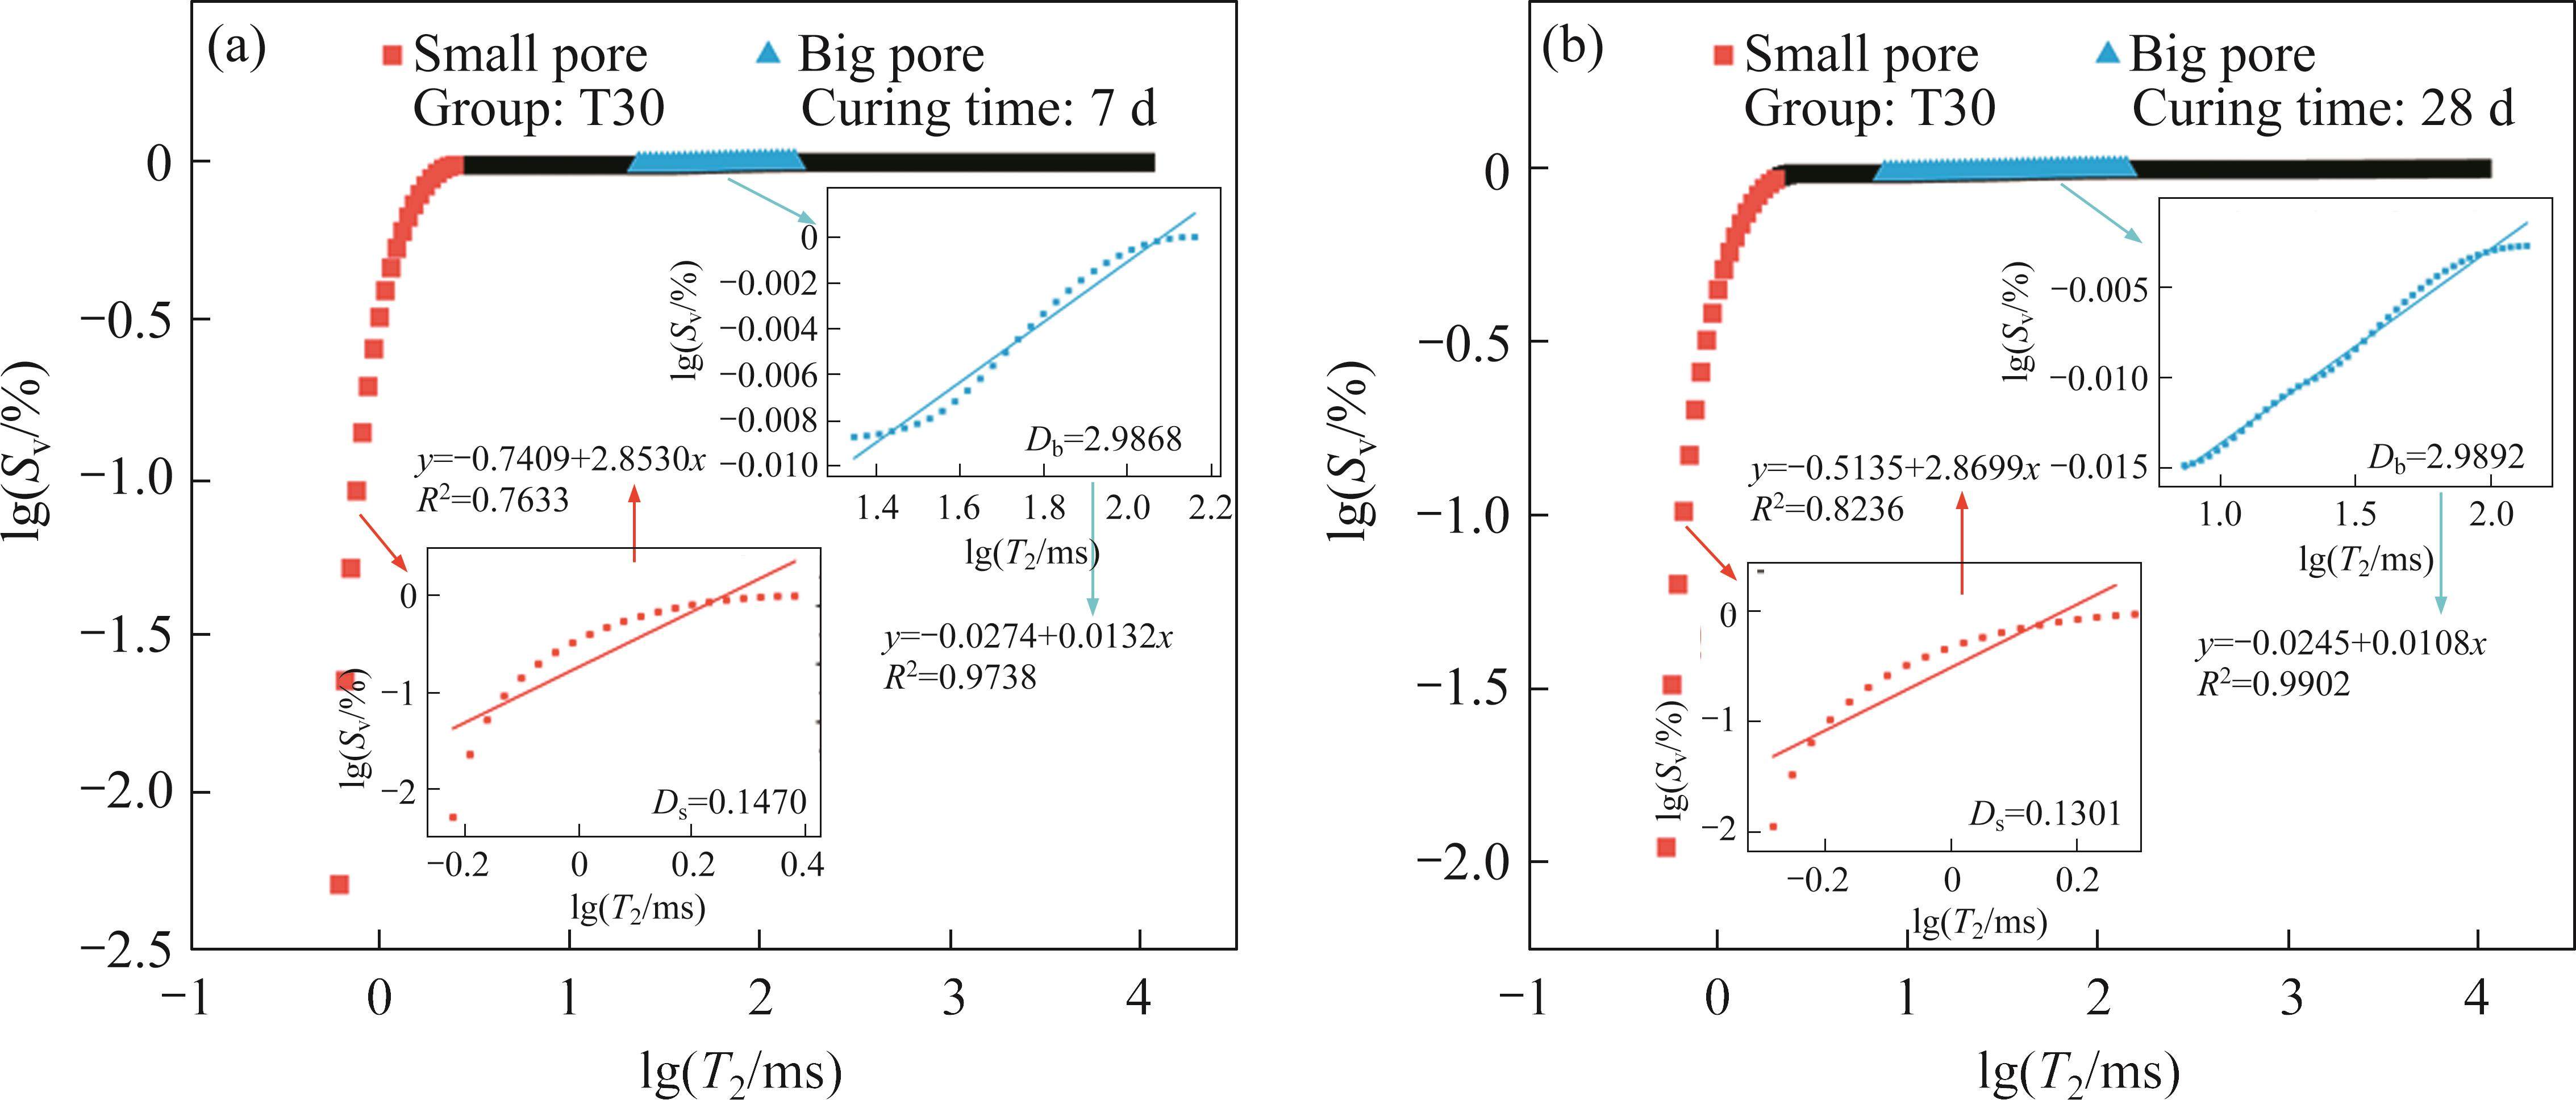
According to Eq. (4), lgSv and lgT2 are linearly correlated. The fractal dimension (D) can be calculated from the slope of Eq. (4). Figures 10-14 show the calculated fractal dimensions of the pores in the five groups of SSCB backfill at different curing times. The Ds of the small pores of the 5 groups of SSCB backfill after 7 d of curing were 0.4059, 0.2988, 0.2028, 0.2449 and 0.1470, while the Ds after 28 d of curing were 0.4597, 0.3415, 0.3298, 0.2954, and 0.1301. The Db of the big pores of the backfill after 7 d of curing were 2.9795, 2.9863, 2.9864, 2.9849, and 2.9868, while Dh after 28 d of curing were 2.9849, 2.9901, 2.9887, 2.9899 and 2.9892. According to the calculations, Db were much larger than that of the Ds, indicating that the big pores can accommodate the fine particles and hydration products, which contributes to a more complex pore structure. The Ds in the backfill were smaller, indicating their relative independence and homogeneity.
The correlation between the silica fume contents and Ds is seen in Figure 15(a). It was found that the correlation between them was strong, with a significant linear relationship. The Ds decreased with increasing silica fume content. This indicates that the increase in the silica fume content reduced the overall complexity of small pores and enhanced their homogeneity. The figure showed that the Ds after 28 d of curing was slightly larger than that after 7 d of curing. The difference between them decreased with increasing silica fume content.
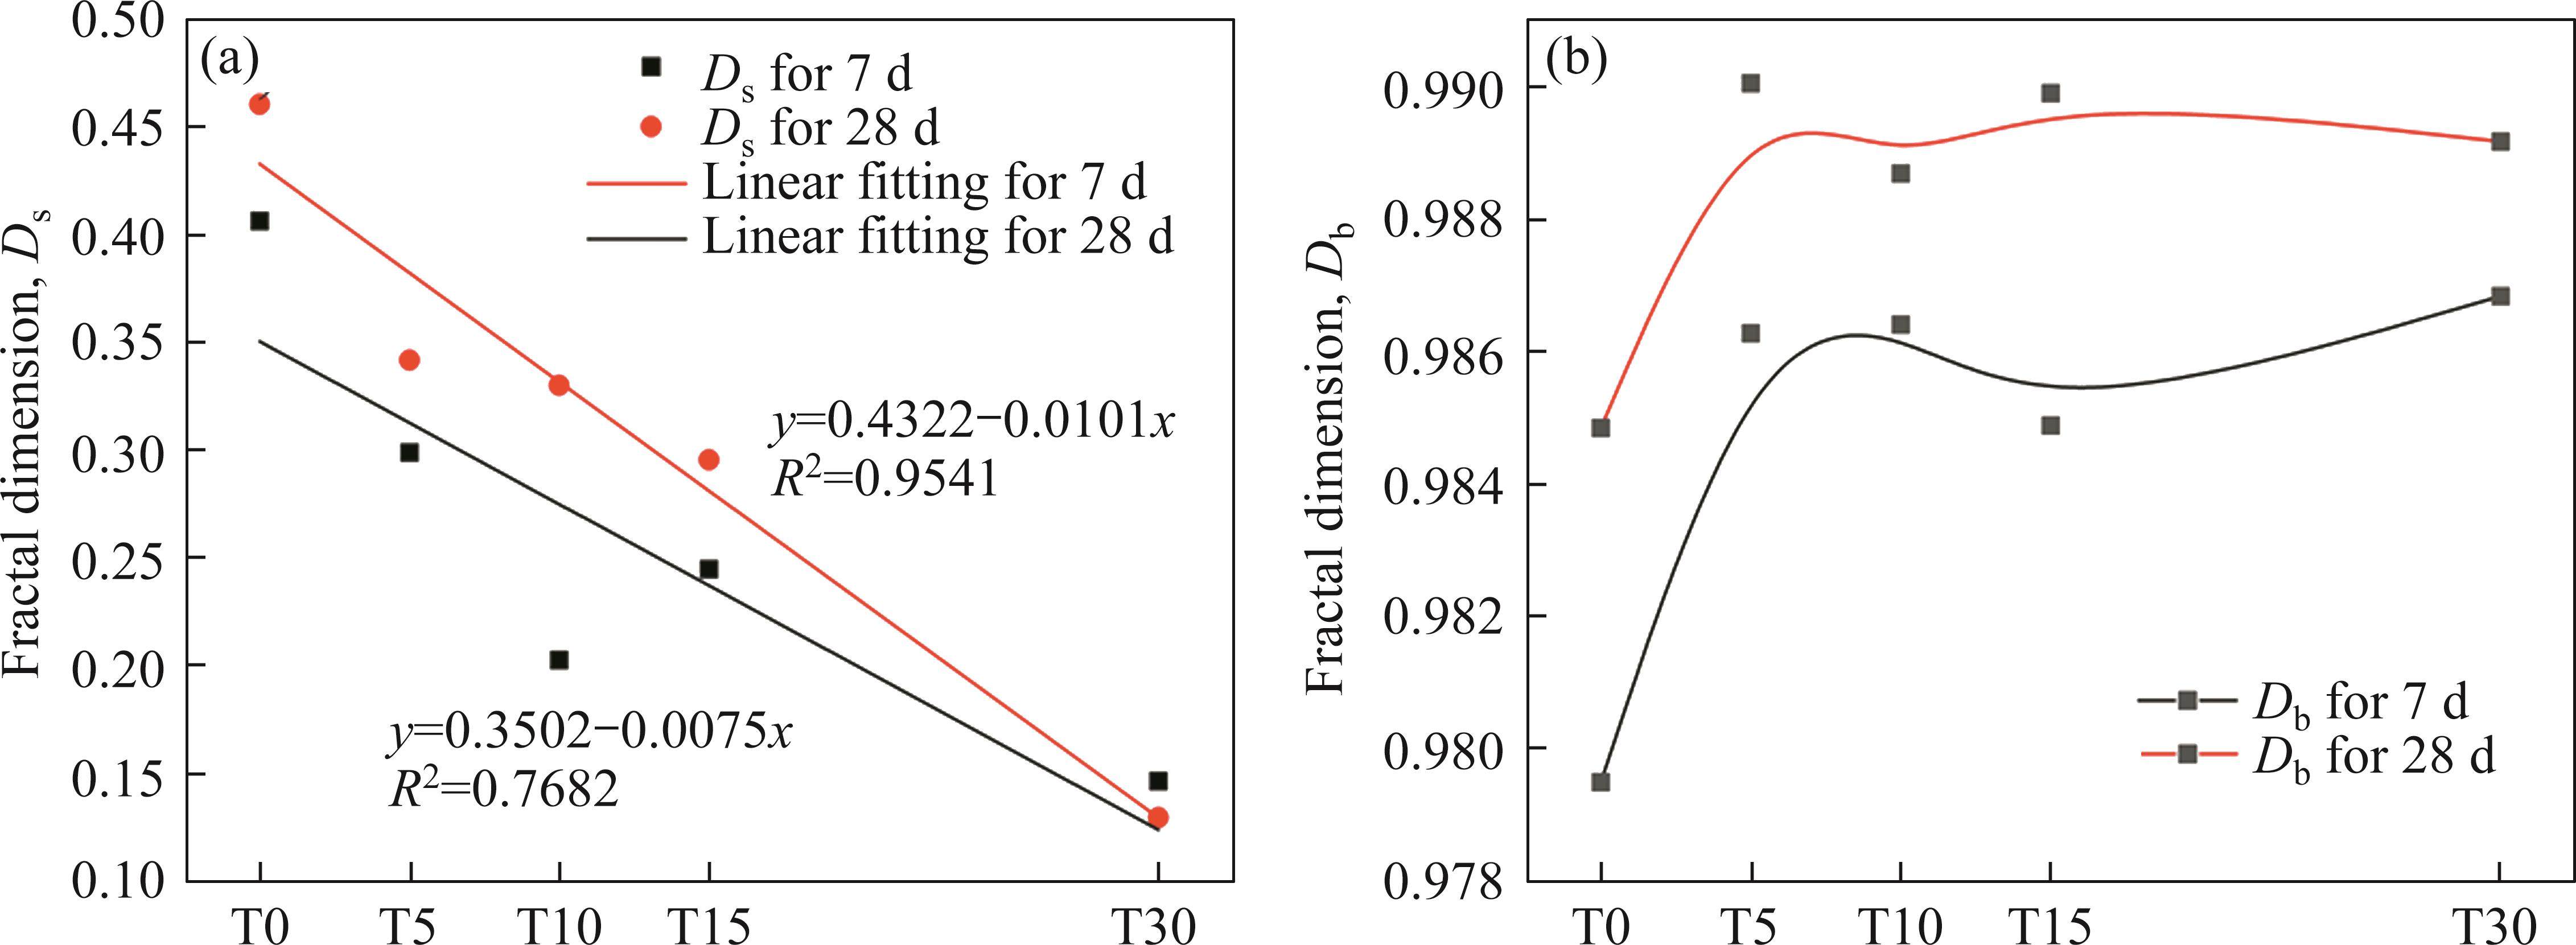
The correlation between the silica fume contents and Db is seen in Figure 15(b). The correlation between the Db and silica fume content was not strong when fitted for different curing time. The figure shows that with an increase in the silica fume content, the Db in the SSCB backfill first showed a rising trend and subsequently fluctuated flat. This shows that the silica fume addition increased the complexity of big pores in the backfill. However, the continued addition of silica fume did not considerably improve the Db of the big pores.
4.2.2 Relationship between fractal dimension and macroscopic characteristics
Figure 16(a) shows the connection between the Ds and the UCS at different curing time. According to the figure, the relationship is linearly negative, similar to the results of DING et al [41]. At this point, a larger fractal dimension indicates a more complex pore structure and greater irregularity in the small pores, which is detrimental to the UCS [42]. Figure 16(b) depicts the correlation between the UCS of the SSCB backfill and the Db at various curing periods. Fitting of the Db and UCS showed weak correlation coefficients. This weak correlation was attributed to the relatively small percentage of big pores. However, the overall trend showed that the Db gradually increased with the UCS. The overall trend is opposite to that of small pores because the increase in the Db is mainly reflected in changes of the pore structure by hydration products and fine particles filling the pores.
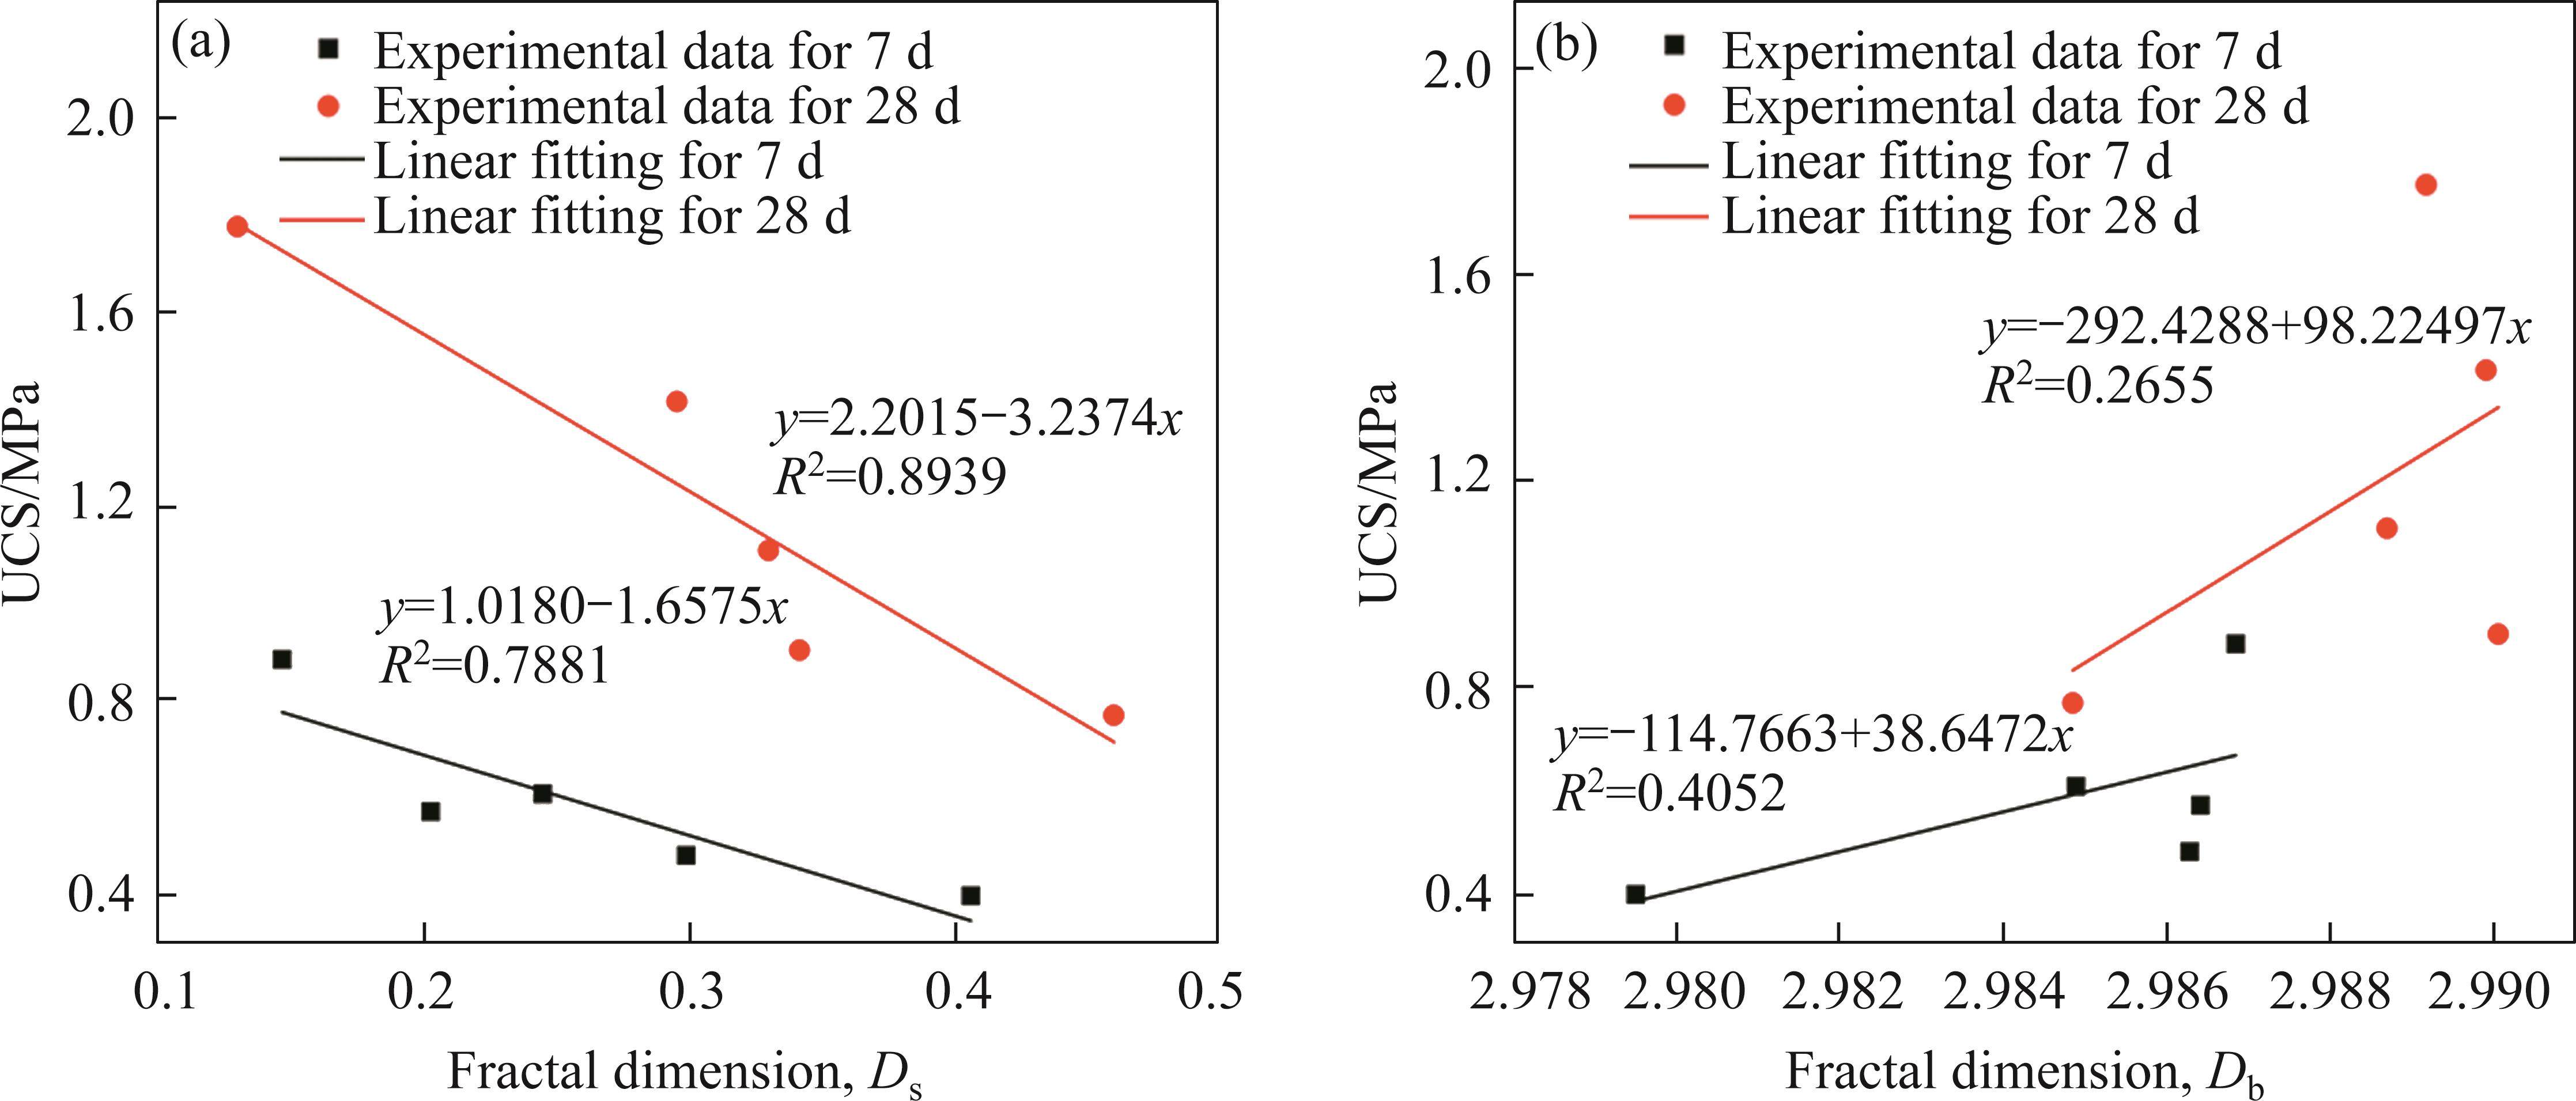
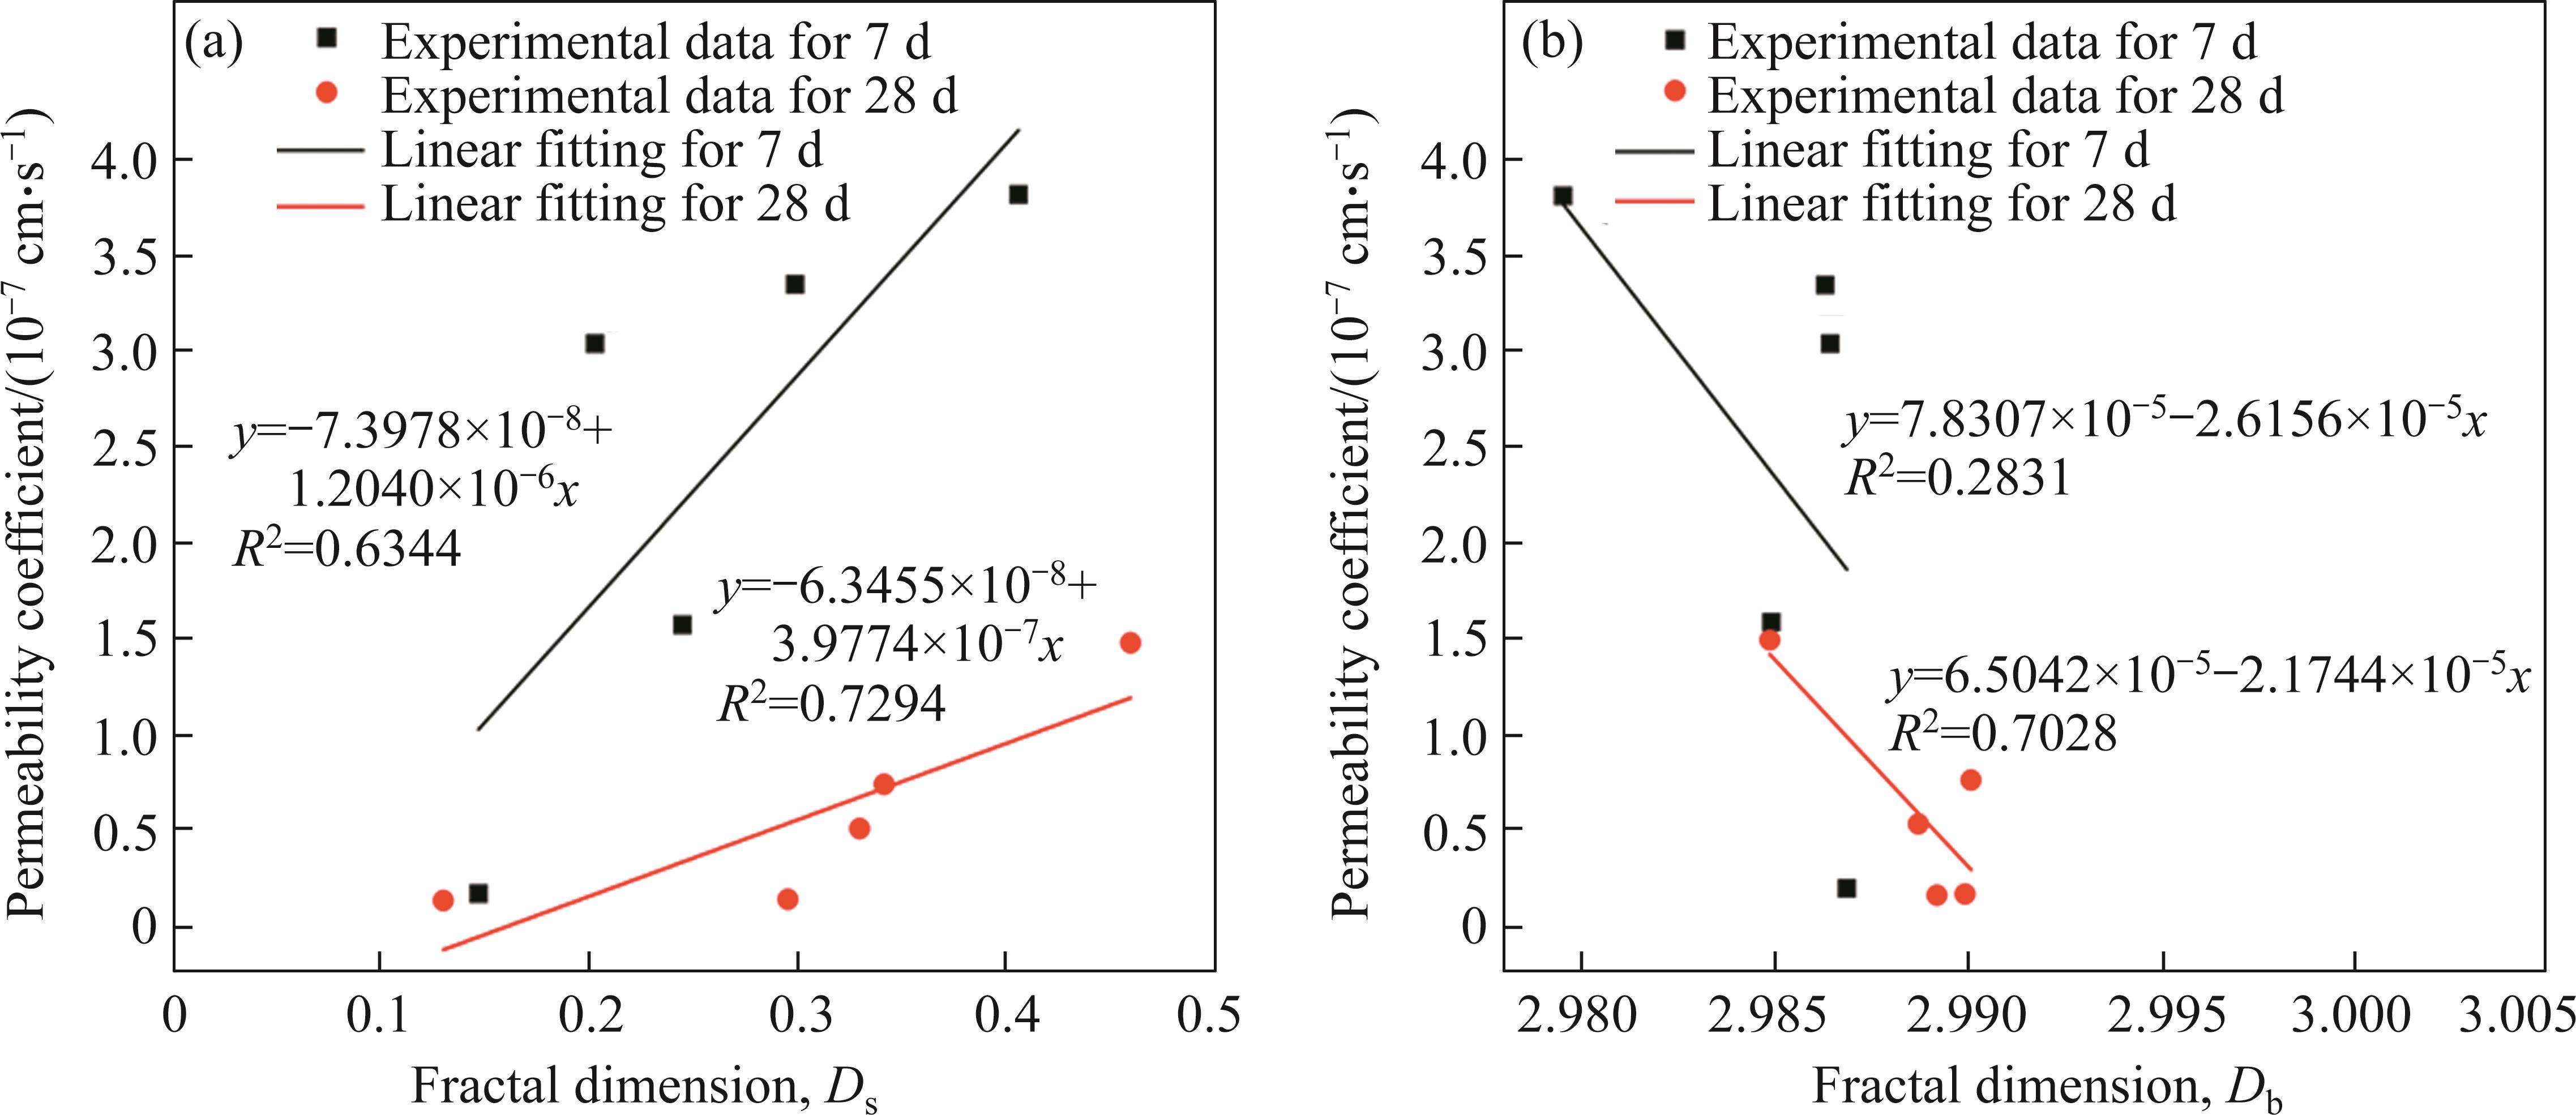
Figure 17(a) depicts the correlation between the permeability coefficients of the SSCB backfill and the Ds at various curing periods. This shows that as the Ds rose, so did the permeability coefficient of SSCB backfill. The main reason for this phenomenon is that the SSCB backfill with a big pores fractal dimension of small pores has a stronger pore irregularity and interpore connectivity, which is detrimental to the impermeability of the material. Figure 17(b) shows the correlation between the Db and the SSCB backfill permeability coefficient at different curing time. Fitting of Db and permeability coefficient showed that the relationship is linear and negative. The main reason for the different trends is that the filling of hydration products with fine particles increased the structural complexity of big pores, which increased the complexity of the water channels passing between the big pores and enhanced the water barrier capacity of the backfill. In summary, the complexity of small pores is the key factor affecting macroscopic characteristics of SSCB backfill.
5 Conclusions
In this study, SSCB backfill was prepared. The influence of silica fume on the multiscale characteristics of SSCB backfill was investigated. The following conclusions are drawn.
Silica fume incorporation enhanced the SSCB backfill’s engineering performance. Silica fume addition to the backfill soil induces a strength increase in the middle and late curing stages, but a permeability coefficient decrease in the early curing stage. This characteristic benefits practical projects, especially the repair of cutoff wall leakage areas. The test results recommend a 15% silica fume substitution ratio. Silica fume addition reduced the SSCB backfill’s porosity and improved its pore structure. Moreover, the silica fume effect on the backfill’s porosity reduction weakened as the addition amount increased. The SSCB backfill strength and permeability coefficient are negatively and positively correlated with the porosity, respectively. The SSCB backfill macro engineering characteristics strongly correlate with the small pore complexity. In general, the SSCB backfill soil’s strength and permeability coefficient decrease and increase, respectively, as the small pore complexity increases.
Hydromechanical characterization of cement-bentonite slurries in the context of cutoff wall applications
[J]. Journal of Materials in Civil Engineering, 2016, 28(2):Use of self-hardening slurry for trench cutoff wall: A review
[J]. Construction and Building Materials, 2021, 286: 122959. DOI: 10.1016/j.conbuildmat.2021.122959.Remediation techniques for heavy metal-contaminated soils: Principles and applicability
[J]. Science of the Total Environment, 2018, 633: 206-219. DOI: 10.1016/j.scitotenv.2018.03.161.Case study: Construction and in situ hydraulic conductivity evaluation of a deep soil-cement-bentonite cutoff wall
[C]//Slag-cement-bentonite slurry walls
[J]. Journal of Geotechnical and Geoenvironmental Engineering, 2005, 131(6): 673-681. DOI: 10.1061/(asce)109 0-0241(2005)131:6(673).Use of granulated blast furnace slag and lime in cement-bentonite slurry wall construction
[J]. International Journal of Geotechnical Engineering, 2016, 10(1): 81-85. DOI: 10.1179/1939787915Y.0000000005.Influence of wet-dry cycles on vertical cutoff walls made of reactive magnesia-slag-bentonite-soil mixtures
[J]. Journal of Zhejiang University: Science A, 2019, 20(12): 948-960. DOI: 10.1631/jzus.A1900300.Reactive MgO-based self-healing slag-cement-bentonite slurry walls
[J]. Cement and Concrete Composites, 2022, 131: 104565. DOI: 10.1016/j.cemconcomp.2022.104565.Hydration and properties of sodium sulfate activated slag
[J]. Cement and Concrete Composites, 2013, 37: 20-29. DOI: 10.1016/j.cemconcomp.2012.12.010.Strength, microstructure, and deformation behavior of frozen cemented tailing material
[J]. Journal of Cold Regions Engineering, 2022, 36(1):Sulphate induced changes in the reactivity of cemented tailings backfill
[J]. International Journal of Mineral Processing, 2017, 166: 13-23. DOI: 10.1016/j.minpro.2017.06.007.Experimental study on the effect of fly ash content in cemented paste backfill on its anti-sulfate erosion
[J]. International Journal of Green Energy, 2020, 17(12): 730-741. DOI: 10.1080/154350 75.2020.1791877.Influence of granulated blast furnace slag on the reaction, structure and properties of fly ash based geopolymer
[J]. Journal of Materials Science, 2010, 45(3): 607-615. DOI: 10.1007/s108 53-009-3934-5.Effect of nano-silica on strength and durability of fly ash based geopolymer mortar
[J]. Construction and Building Materials, 2014, 70: 453-459. DOI: 10.1016/j.conbuildmat.2014.07.093.Effect of silica fume on the mechanical properties of fly ash based-geopolymer concrete
[J]. Ceramics International, 2016, 42(2): 3000-3006. DOI: 10.1016/j.ceramint.2015.10.084.Cross-scale characteristics of backfill material using NMR and fractal theory
[J]. Transactions of Nonferrous Metals Society of China, 2020, 30(5): 1347-1363. DOI: 10.1016/S1003-6326(20)65301-8.Strength characteristics and the reaction mechanism of stone powder cement tailings backfill
[J]. Advances in Materials Science and Engineering, 2018, 2018(1): 8651239. DOI: 10.1155/2018/8651239.Properties of cemented phosphogypsum (PG) backfill in case of partially substitution of composite Portland cement by ground granulated blast furnace slag
[J]. Construction and Building Materials, 2021, 305: 124786. DOI: 10.1016/j.conbuildmat. 2021.124786.Utilization of industrial waste products as pozzolanic material in cemented paste backfill of high sulphide mill tailings
[J]. Journal of Hazardous Materials, 2009, 168(2, 3): 848-856. DOI: 10.1016/j.jhazmat.2009.02.100.Mechanical characterization of high performance concrete prepared with recycled aggregates and silica fume from precast industry
[J]. Journal of Cleaner Production, 2017, 164: 939-949. DOI: 10. 1016/j.jclepro.2017.06.249.Influence of silica fume on mechanical property of cemented paste backfill
[J]. Construction and Building Materials, 2022, 317: 126089. DOI: 10.1016/j.conbuildmat.2021.126089.Investigating the effect of the cement paste and transition zone on strength development of concrete containing nanosilica and silica fume
[J]. Materials & Design, 2015, 75: 174-183. DOI: 10.1016/j.matdes.2015. 03.024.The effect of silica fume on durability of alkali activated slag concrete
[J]. Construction and Building Materials, 2017, 134: 262-268. DOI: 10.1016/j.conbuildmat.2016.12.072.Experimental study on strength and durability of lightweight aggregate concrete containing silica fume
[J]. Construction and Building Materials, 2016, 114: 517-527. DOI: 10.1016/j.conbuildmat. 2016.03.165.Effects of silica fume on the performance of cemented paste backfill mixed with brine
[J]. Geotechnical and Geological Engineering, 2019, 37(5): 4575-4587. DOI: 10.1007/s10706-019-01011-y.Mechanical and durability properties of waste rubber fiber concrete with and without silica fume
[J]. Journal of Cleaner Production, 2016, 112: 702-711. DOI: 10.1016/j.jclepro.2015.07.081.Strength development and microstructure characteristics of artificial concrete pillar considering fiber type and content effects
[J]. Construction and Building Materials, 2020, 256: 119408. DOI: 10.1016/j.conbuildmat.2020.119408.Influence of silica fume and low curing temperature on mechanical property of cemented paste backfill
[J]. Construction and Building Materials, 2020, 254: 119305. DOI:10.1016/j.conbuildmat. 2020.119305.Engineering characteristics and microscopic mechanism of soil-cement-bentonite (SCB) cut-off wall backfills with a fixed fluidity
[J]. Materials, 2023, 16(14): 4971. DOI:10.3390/ma1614 4971.The engineering properties and reaction mechanism of MgO-activated slag cement-clayey sand-bentonite (MSB) cutoff wall backfills
[J]. Construction and Building Materials, 2021, 271: 121890. DOI: 10.1016/j.conbuildmat.2020.121890.Influence of air entraining agent on strength and microstructure properties of cemented paste backfill
[J]. IEEE Access, 2019, 7: 140899-140907. DOI: 10.1109/ACCESS.2019.2942360.Microscopic characteristics of the action of an air entraining agent on cemented paste backfill pores
[J]. Alexandria Engineering Journal, 2020, 59(3): 1583-1593. DOI: 10.1016/j.aej.2020.04.005.Pore structure characteristics and its effect on mechanical performance of cemented paste backfill
[J]. Frontiers in Materials, 2021, 8: 700917. DOI: 10.3389/fmats.2021.700917.Experimental investigation on the relationship between pore characteristics and unconfined compressive strength of cemented paste backfill
[J]. Construction and Building Materials, 2018, 179: 254-264. DOI: 10.1016/j.conbuildmat. 2018.05.224.Measuring the pore structure of cement asphalt mortar by nuclear magnetic resonance
[J]. Construction and Building Materials, 2017, 137: 450-458. DOI: 10.1016/j.conbuildmat. 2017.01.109.Influence of silica fume addition on concretes physical properties and on corrosion behaviour of reinforcement bars
[J]. Cement and Concrete Composites, 2004, 26(1): 31-39. DOI: 10.1016/S0958-9465(02)00120-8.Performance comparison between densified and undensified silica fume in ultra-high performance fiber-reinforced concrete
[J]. Materials, 2020, 13(17): 3901. DOI: 10.3390/ma13173901.Hydration and microstructures of concrete containing raw or densified silica fume at different curing temperatures
[J]. Construction and Building Materials, 2016, 121: 483-490. DOI: 10.1016/j.conbuildmat.2016.06.014.Micro/nanoscale pore structure and fractal characteristics of tight gas sandstone: A case study from the Yuanba area, northeast Sichuan Basin, China
[J]. Marine and Petroleum Geology, 2018, 98: 116-132. DOI: 10.1016/j.marpetgeo.2018.08.013.Characteristics of shale pores, fractal dimension and their controlling factors determined by nitrogen adsorption and mercury injection methods
[J]. Petroleum Geology and Recovery Efficiency, 2016, 23(2): 1-8. DOI: 10.3969/j.issn. 1009-9603.2016.02.001. (in Chinese)Study on correlation between fractal characteristics of pore distribution and strength of sandstone particles
[J]. Chinese Journal of Rock Mechanics and Engineering, 2020, 39(9): 1787-1796. DOI: 10.13722/j.cnki.jrme.2019.1555. (in Chinese)Relationship between fractal feature and compressive strength of concrete based on MIP
[J]. Construction and Building Materials, 2022, 322: 126504. DOI: 10.1016/j.conbuildmat.2022.12 6504.ZHOU Tan, HU Jian-hua, ZHAO Feng-wen, GUO Meng-meng and XUE Sheng-guo declare that they have no conflict of interest.
ZHOU Tan, HU Jian-hua, ZHAO Feng-wen, GUO Meng-meng, XUE Sheng-guo. Effects of silica fume on the multi-scale material properties of composite Portland cement-based cutoff wall backfill [J]. Journal of Central South University, 2025, 32(1): 205-219. DOI: https://doi.org/10.1007/s11771-025-5868-8.
周坦,胡建华,赵风文等.硅灰对土-水泥-膨润土(SCB)竖向隔离屏障多尺度特性影响[J].中南大学学报(英文版),2025,32(1):205-219.

